Revenue and Fund Management Dashboard
The Revenue and Fund Management (RFM) Dashboard displays information about revenue and fund management including details on fund statements, journals, transfers, fund trends, trial balances, fund variances, budget variances, budget transactions, endowments and donor pledges.
Launch OBI Revenue and Fund Management Reporting Dashboard
| Select this link... | ...for reports about |
|---|---|
| Award at a Glance | Fund overviews; Award Attributes, SU Fund Summary, EN Fund Summary, Fiscal Year Anticipated Payout Summary, SU GL Balance Trend, EN GL Balance Trend, Endowment Activity, GL Transactions and Pledge Summary. |
| Award Attributes | Award attributes including org, name, status, type, purpose, owner, manager and relevant dates. |
| Fund Statement | Fund statement for EN & SU sets of books showing beginning balance, transactional activity and ending balance for the reporting period (similar to RM3 153, 154, 154a, 156 and 158 reports). For non-sponsored and non-capital awards. |
| Fiscal to Date (FTD) Fund Statement (Current and prior year only) | Non-customizable FTD Fund Statement for EN & SU sets of books showing beginning balance, transactional activity, and ending balance. For non-sponsored and non-capital awards. Current fiscal year and prior fiscal year data only, for faster performance. (formerly the RM3 FIN_FUND_153A_Fund_Statement but limited to current and prior fiscal year) |
| Fiscal to Date (FTD) Fund Statement | Non-customizable FTD Fund Statement for EN & SU sets of books showing beginning balance, transactional activity and ending balance (formerly the RM3 FIN_FUND_153_Fund_Statement). For non-sponsored and non-capital awards. |
| Award Status Fund Statement | Non-customizable fund statement showing current status (FTD actuals, expense control, commitments) of projects and funds prior to year-end and during year-end close. Also provides information that will assist in the ability to fund deficits or reallocate surpluses as needed to close operating budget awards at year-end (formerly FIN_FUND_253_YTD_Award_Status report). |
| Operating Statement and Clinical Trials Statement | Non-customizable operating statement detail with revenues, expenditures for last month selected as well as annual revenue/expense controls (budget), fiscal year to date actuals and variances (formerly FIN_OP_101_Operating_Detail & FIN_OP_101A_SPO_Clinical_Trials_Statement). |
| GL Journal Details | Provides General Ledger (GL) journal transaction details (similar to RM3 161, 162 and 252 reports). |
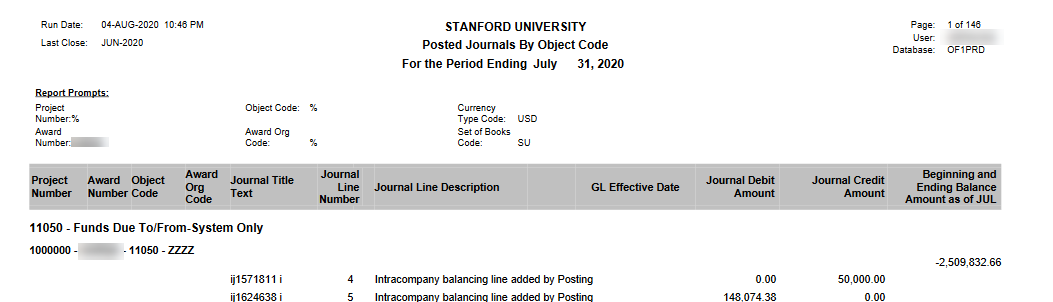
| Posted Journals by Object Code (real-time) | Non-customizable report displays the posted journal line detail for a single period and given PFOO (formerly the RM3 FIN_GL_161_Post_Jrnl_By_Obj_Code and RM3 FIN_GL_162_Central_Jrnls_By_Obj reports). |
| Transfer Summary Report | Transfers of funds between awards (object codes 49100 to 49699); displays both to and from awards, projects and related attributes. |
| Transfer Detail Report | Transfers of funds between awards (object codes 49100 to 49699); displays both to and from Awards, Projects and related attributes. |
| Fund Trend | Fund statements for EN & SU sets of books showing values over time in user selectable time periods, includes line graph representations (similar to RM3 152 and 283 reports). |
| Comparative Trial Balance by Object Code |
Statement of Position (object codes beginning with 1,2 or 3) shows ending balance as of a selected period and the same period of prior year. Statement of Activity (object codes beginning with 4 or 5) shows year to date activities for a selected period and the same period of prior year. |
| Operating Statement Month by Month | Provides monthly operating statement summary information by award and object code, sectioned by revenue, fund transfers, expenditures, gain/loss and capital transfers. The yearly information also provides summary information on other assets and liabilities codes (formerly FIN_OP_284_Mo_By_Mo _Month-by-Month report). |
| Operating Statement Year by Year | Provides yearly operating statement summary information by award and object code, sectioned by revenue, fund transfers, expenditures, gain/loss and capital transfers. The yearly information also provides summary information on other assets and liabilities codes (formerly FIN_OP_284_Mo_By_Mo_Year-By-Year report). |
| Fund Variance | Variance of two fund statements of differing reporting periods to show their values and differences (similar to RM3 238 report). |
| Projected Budget Variance | Projected variance between budget and the sum of actuals, expenditure commitments and anticipated remaining endowment payout. Actuals can be pivoted by GL Period and reporting can be by incremental budget amount, i.e. year to date budget vs year to date actuals. |
| Budget Variance | Variance of budget vs. actual in fund statement format showing values and differences for the reporting period (similar to RM3 165 and 166 reports). |
| Budget Transactions Details | Budget transaction details for Budget Tool (9/1 non-sponsored operating budget), iBudgets (mid year changes to operating budget) and GA Budget (sponsored activity budget) (similar to RM3 165 and 166 reports). |
| Endowment and Donor | Endowment-related data such as investment pools, share quantities, share values, book values and market values. Donor Financial Report with gifts and endowment related data shown in the donor reporting format (similar to RM3 123 and 128 reports). |
| Endowment Award Summary and FTD Investment History | Non-customizable summary including cumulative share balances, book value, market value and ending share value by award with fiscal year-to-date investment history (formerly the RM3 FIN_ENDOW_123_Endow_Display). |
| Endowment Investment Summary by Pool | Non-customizable summary including cumulative share balance, book value and market value by awards within investment pools with a downloadable summary by award number (formerly the RM3 FIN_ENDOW_128_Endow_Investment report). |
| Pledge Report | Shows pledge and pledge schedules for given awards. |
| Unused and Underwater Endowment Funds Dashboard |
Shows awards that are unused and/or underwater. |
| Inactive Awards Report | Shows awards with no transactional activity for the reporting period. |
Award at a Glance
The Award at a Glance Report shows in one place a broad summary of fund management reports covering: Fund overviews; Award Attributes, SU Fund Summary, EN Fund Summary, Fiscal Year Anticipated Payout Summary, SU GL Balance Trend, EN GL Balance Trend, Endowment Activity, GL Transactions and Pledge Summary . This is a collection in one place of other reports in the dashboard. The fund statement area shows a summary across all returned awards.
Demo of Award at a Glance report within the RMF Dashboard in OBI
Sample Business Questions
- What are the awards in my organization (org), their purposes, general status and totals across my org of balances and high level inflows and outflows?
- For specific award(s) what is their financial situation, projected payout for endowment, balances, high-level inflows and outflows?
- Looking at the stats of an award, what numbers look unusual and what are their details when I drill into them?
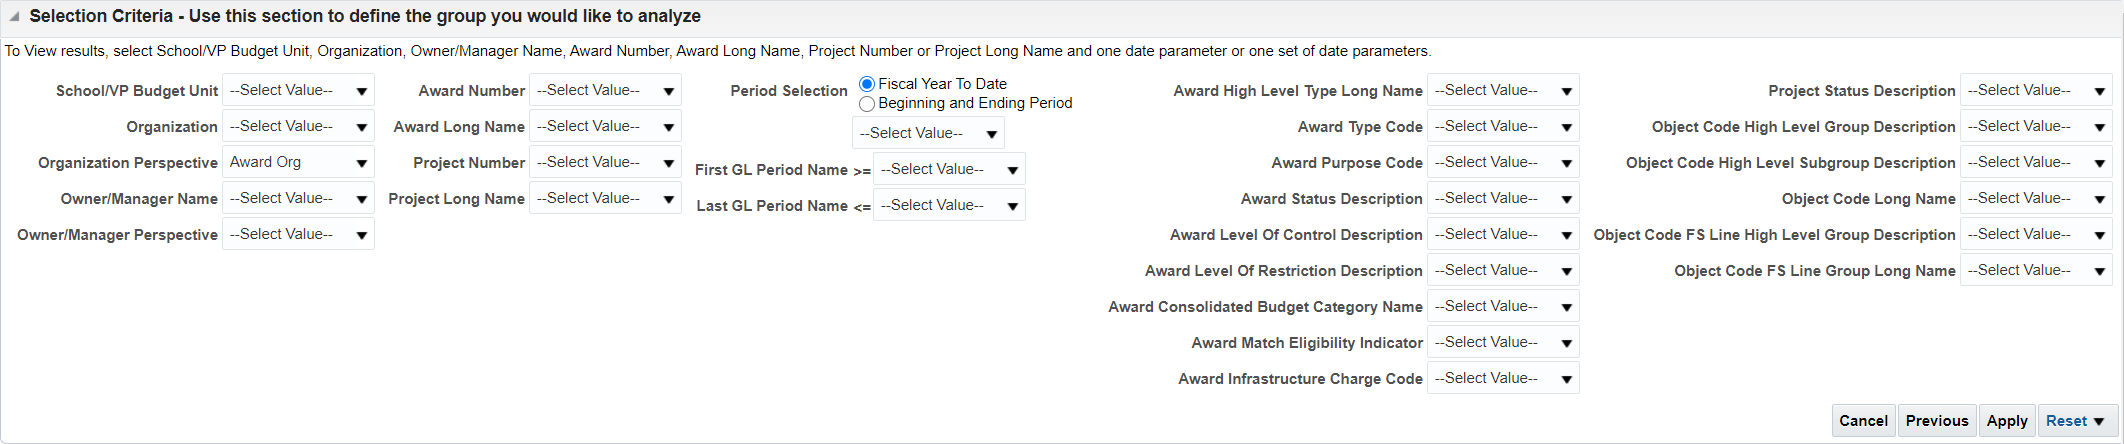
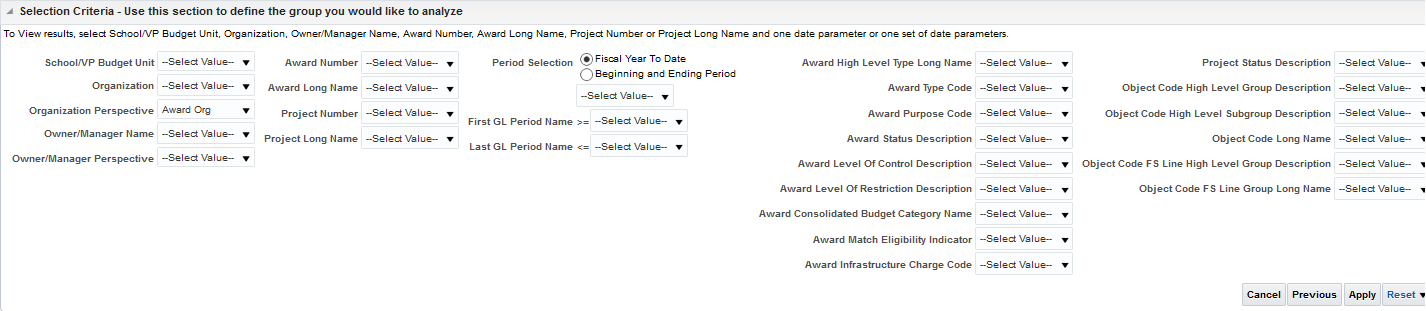
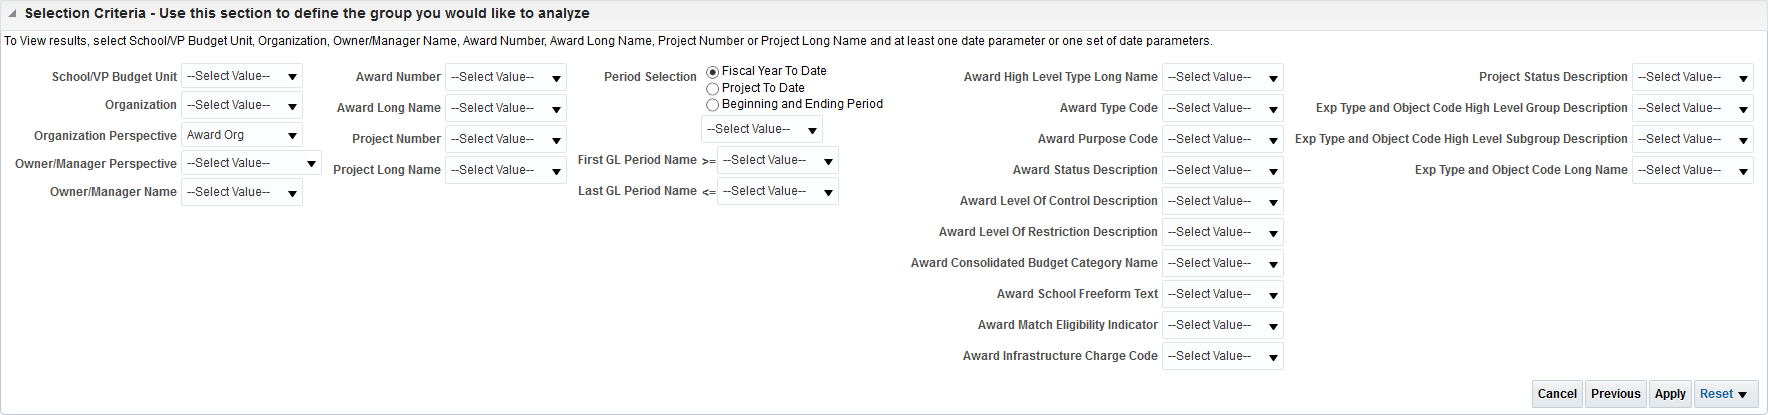
Selection Criteria
- To retrieve results, be sure to follow the Selection Criteria instructions near the top of the screen. Refer to Using Selection Criteria for OBI Reports for more guidance.
Selection Criteria for At-A-Glance reports - For a list of the RFM common selection criteria, their associated list of values and when to use them, refer to RFM Selection Criteria List of Values.
Report Views
The Award at a Glance Report displays report sections that show the overall financial situation for the displayed awards. There are fifteen sections:
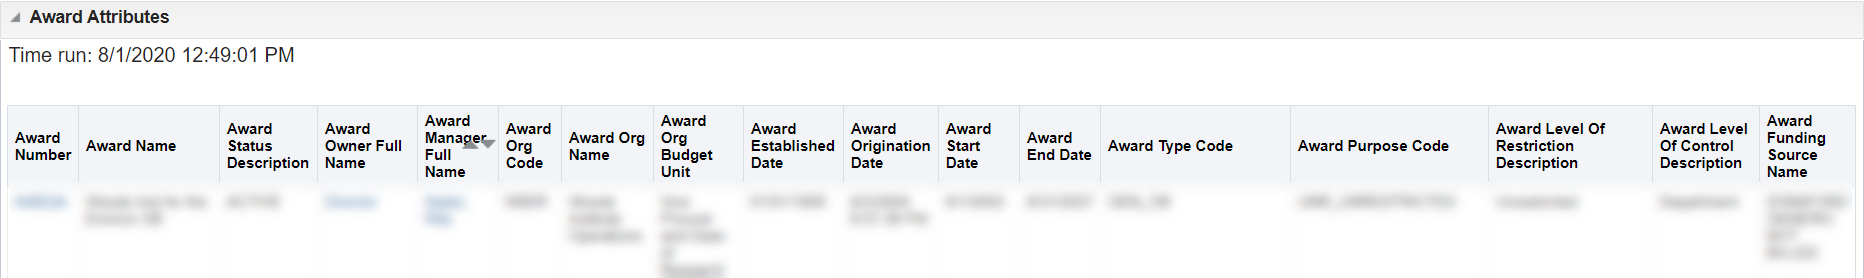
- Award Attributes
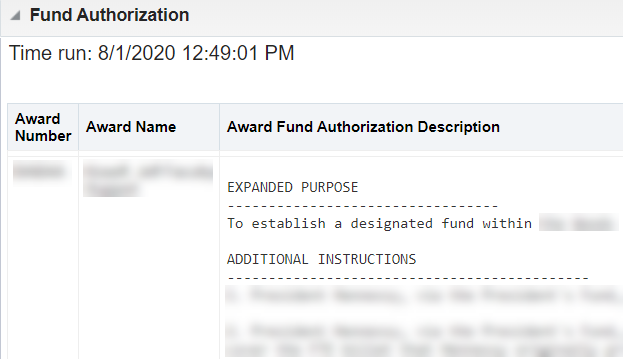
- Fund Authorization
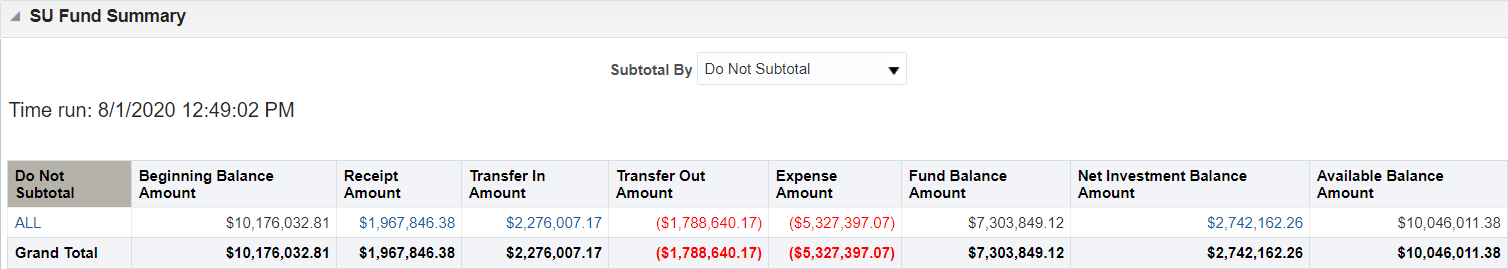
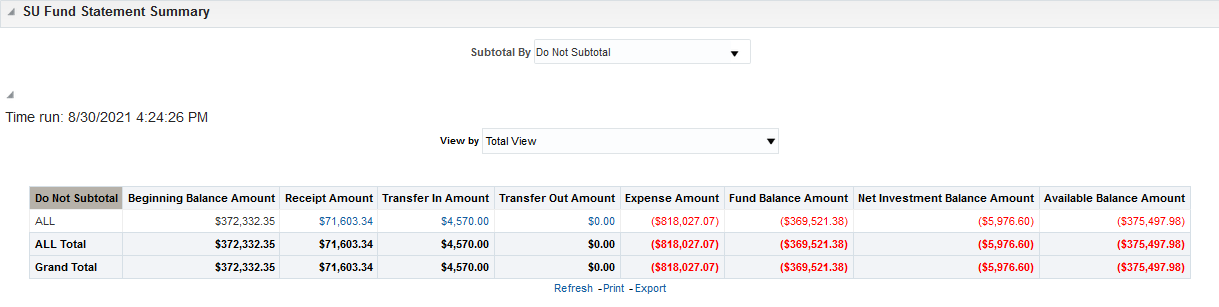
- SU Fund Summary
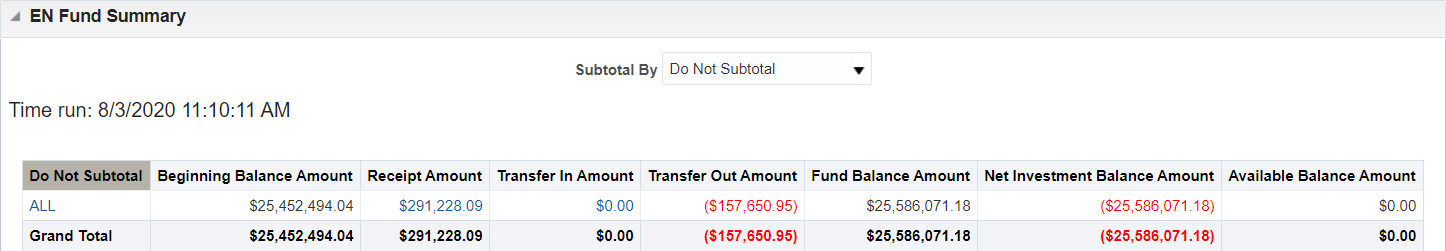
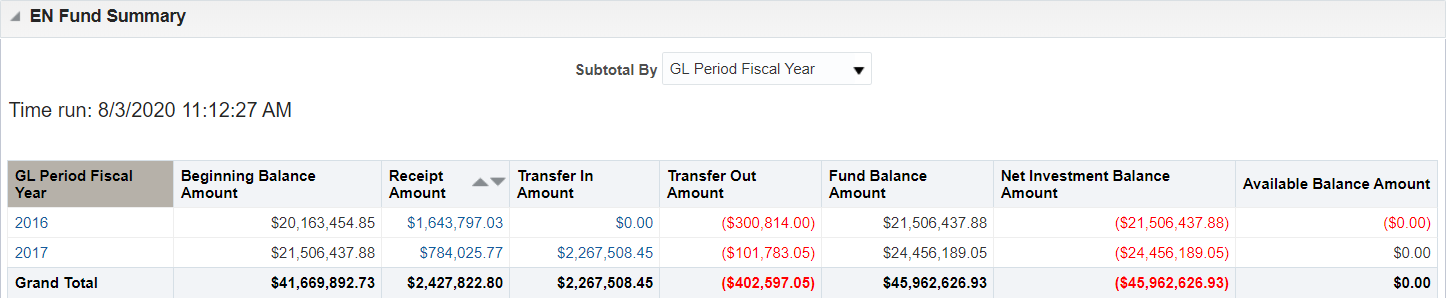
- EN Fund Summary
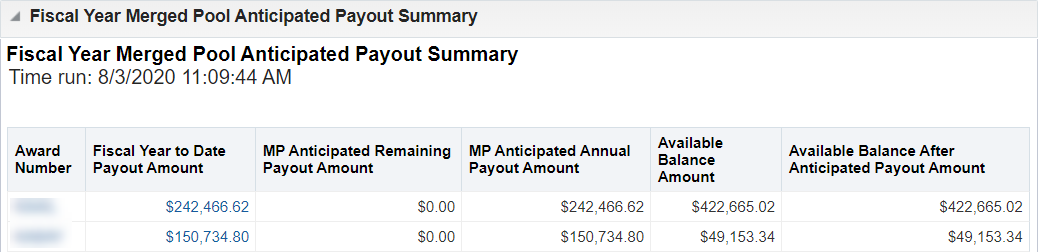
- Fiscal Year Merged Pool Anticipated Payout Summary
- Fund Trend Graph for SU Set of Books
- Fund Trend Graph for EN Set of Books
- Endowment Shares and Market Value
- Specific Investment (for Endowment)
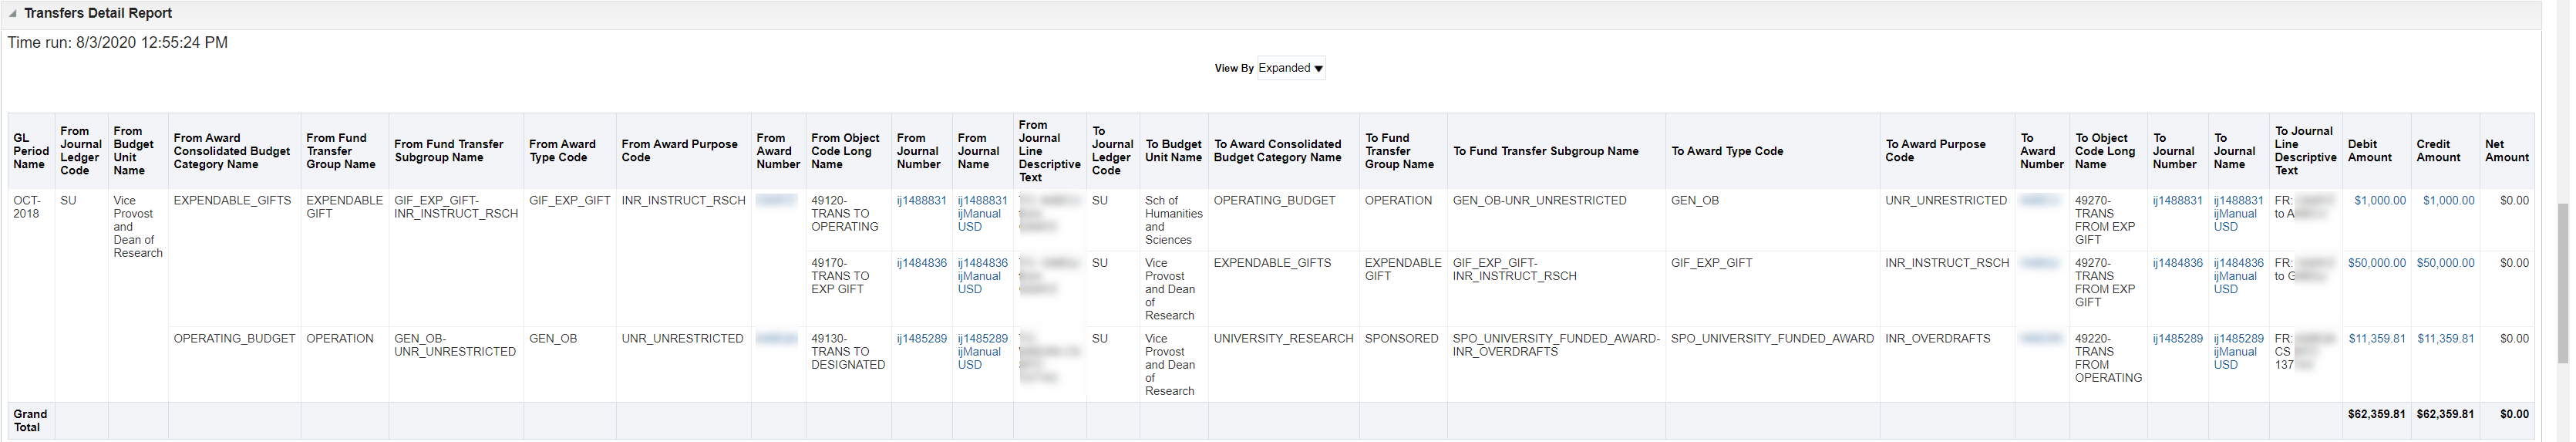
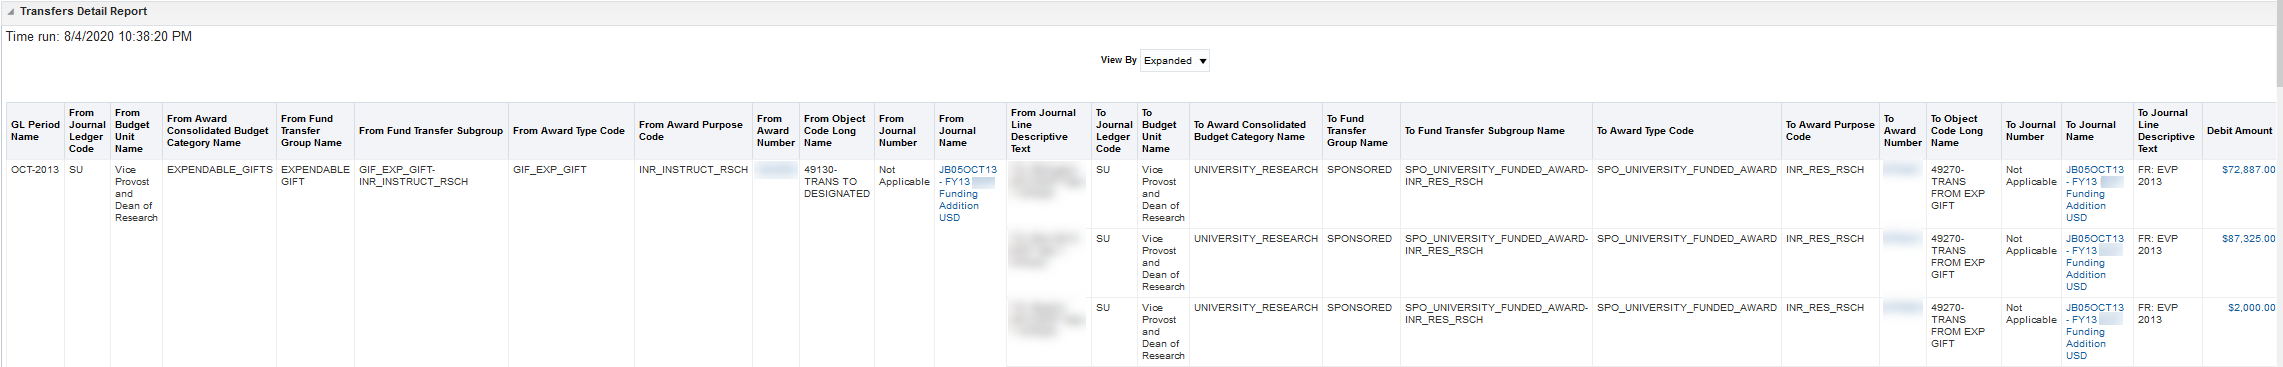
- Transfers Detail Report
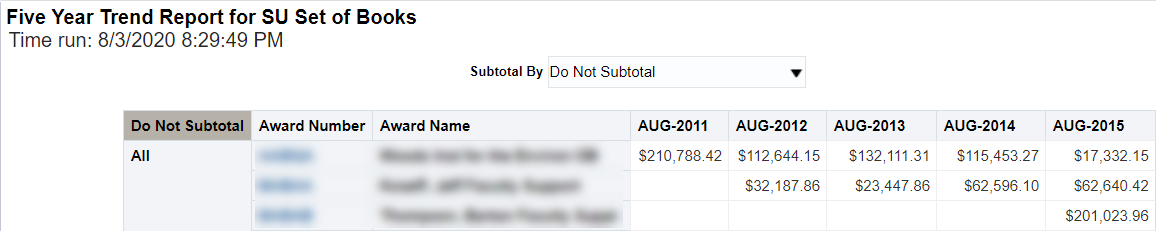
- Five Year Trend Report for SU Set of Books
- Five Year Trend Report for EN Set of Books
- Pledge Summary Report
Award attributes provide details about the setup and parameters associated with the awards or funds, such as award type and purpose codes.
Displays the fund authorization description with expanded purpose, additional instructions, other information and information source. Section is collapsed by default. Select the triangle on the left to expand.
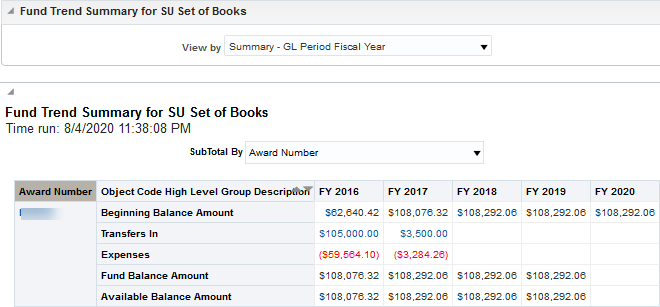
Displays high level summary of account balance, inflows and outflows.
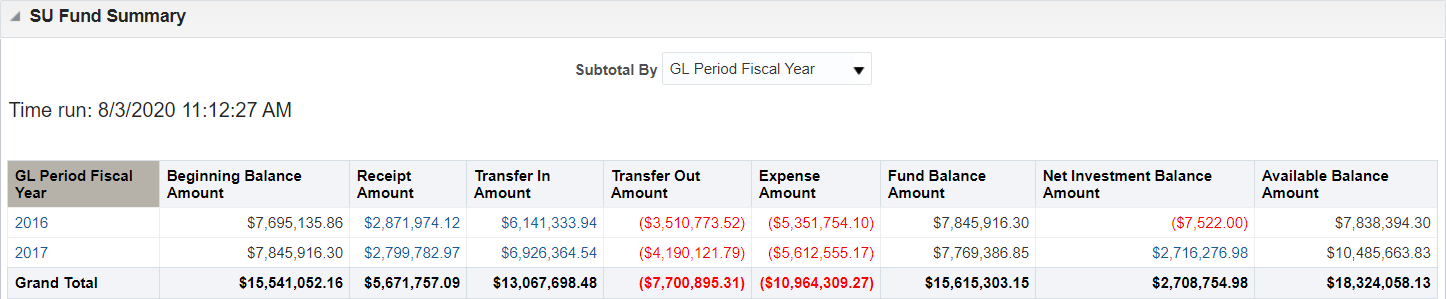
Displays high level summary of account balance, inflows and outflows subtotaled by year.
Displays high level summary of account balance, inflows and outflows.
Displays high level summary of account balance, inflows and outflows subtotaled by year.
For endowments only, shows current balance, payout to date, anticipated payout for the rest of the year and anticipated balance after all payout is received. If this last amount is negative then the fund is projected to be overspent at fiscal year end and expenses may need to be journaled off.
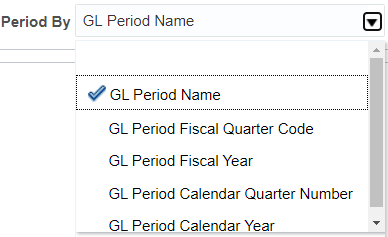
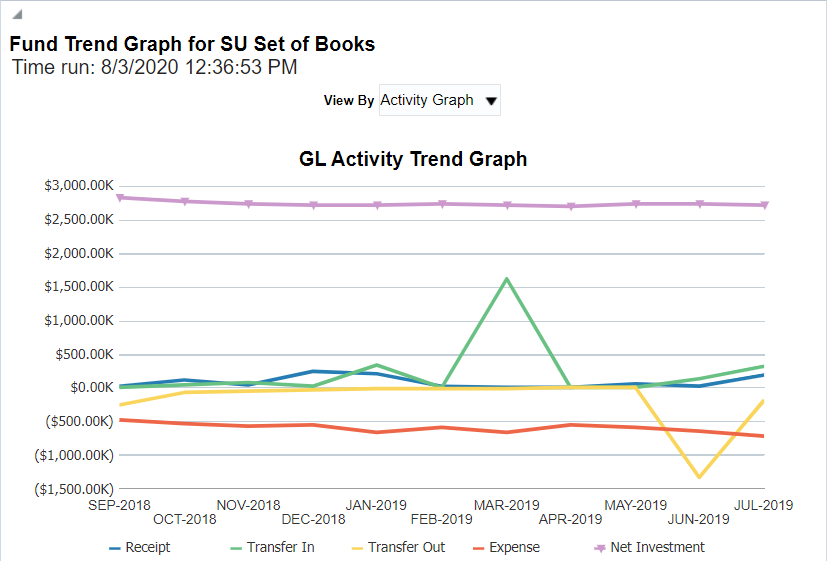
The report sections above for Fund Trend Graph for SU and EN Set of Books have a choice of these time periods for the trend columns. If showing a longer period of time, e.g., years, it is best to select broader time periods like GL Period Fiscal year since there would be so many GL Period Name values.
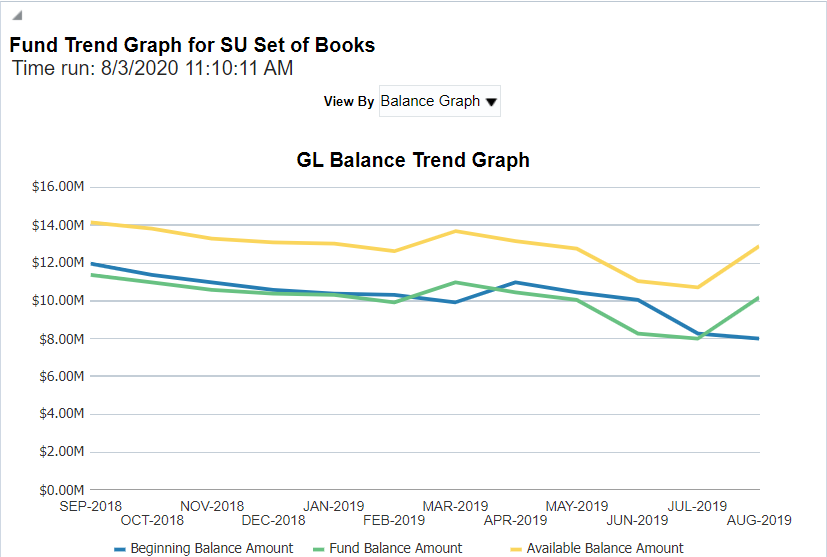
The GL Balance Trend Graph for SU Set of Books shows balance amounts for beginning balance, fund balance and available balance. The fund balance for one period carries forward to become the beginning balance for the next period. The available balance is the fund balance adjusted for accrued assets and liabilities, e.g., the fund balance could be reduced by uncleared advances, but the available balance amount does not carry forward to the next period but is instead calculated based on current accruals.
The GL Activity Trend Graph for SU Set of Books shows the trend for things that affect the balance, such as expenses and receipts. Drilling on a data point reveals underlying details and is useful for researching exceptional values.
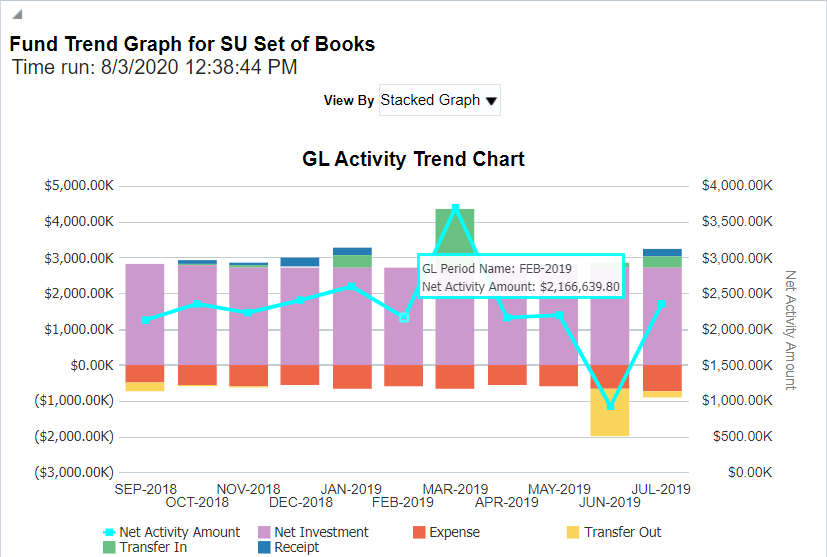
The GL Activity Trend Chart for SU Set of Books shows the trend in a stacked format to highlight positive and negative influences on the balance and show the net activity amount in the form of a line graph whose scale is shown on the right side of the graph, with generally smaller values than the stacked scale on the left side.
The GL Balance Trend Graph for EN Set of Books shows balance amounts for beginning balance, fund balance and available balance. The fund balance for one period carries forward to become the beginning balance for the next period. The available balance is always zero for EN set of books (endowment values) because the endowment value is not available for spending by definition.
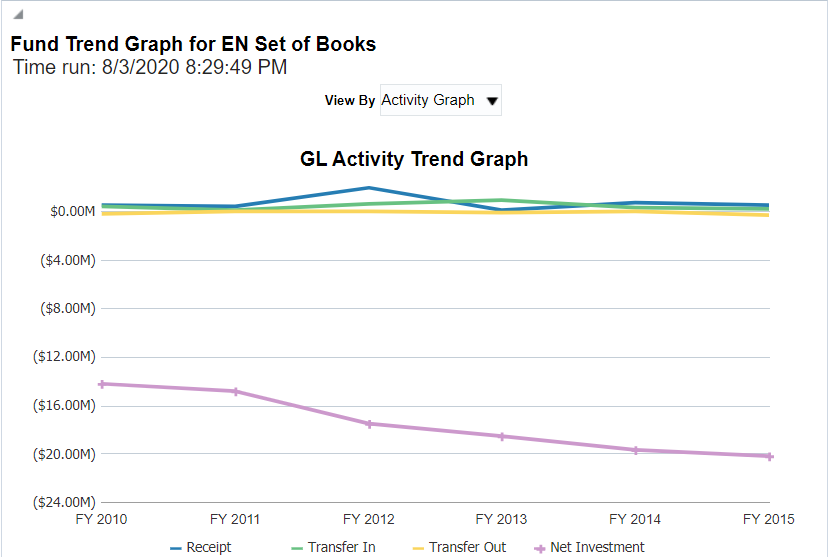
The GL Activity Trend Graph for EN Set of Books shows the trend for things that affect the balance, such as receipts and transfers (expenses do not exist for EN set of books as balances cannot be spent). The Net Investment value is always a negative amount equal to the fund balance so that the sum, or available balance, will be zero. Drilling on a data point reveals underlying details and is useful for researching values.
The GL Activity Trend Chart for EN Set of Books shows the trend in a stacked format to highlight positive and negative influences on the balance and show the net activity amount in the form of a line graph whose scale is shown on the right side of the graph, with generally smaller values than the stacked scale on the left side. Net Activity for EN Set of books is mostly meaningless because the convention on available balance washes out other activities.
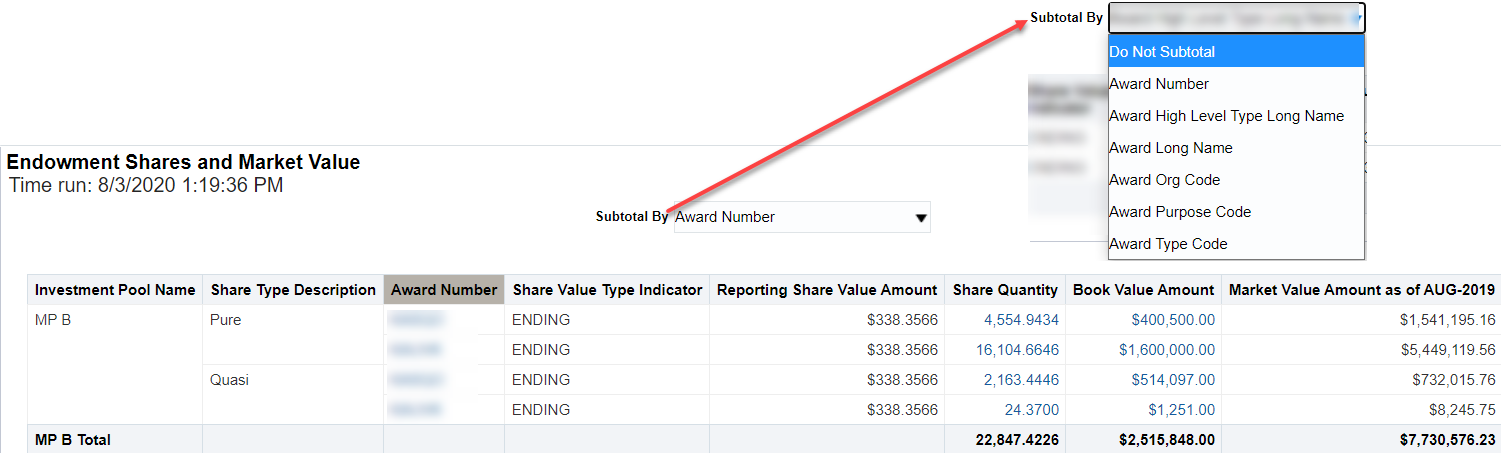
The Subtotal by setting value changes the field displayed in the column titled in dark gray.
The Endowment Shares and Market Value shows key metrics about the EN set of books values including share quantity, share price, market value (share quantity times share price), share type and book value. Note that book value does not change except through additions to capital or in rare cases of sales of share.
Specific Investments shows the value of endowments which are temporarily held in investments outside the merged pool and are not eligible for regular endowment appreciation of value. Eventually they will be liquidated and the proceeds used to buy shares like a regular endowment.
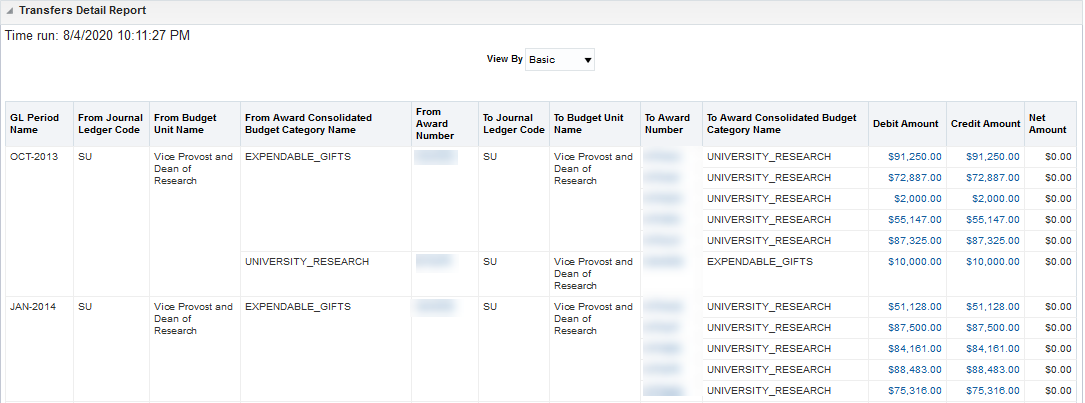
The transfer detail report, View by Basic, provides basic details of transfers to or from the selected funds, in particular the to and from fund/award number.
The transfer detail report, view by Expanded, provides many more details than the basic report. Note that both views pull from the same set of returned data.
The above Five Year Trend reports have a Subtotal By option. Choosing one of these values changed the initial column to display the chosen field, grouping the funds by the field’s values.
The Five Year Trend Report for SU Set of Books displays values by fiscal year for the 5 years prior to the end date selected in the selection criteria. These are the ending fund values.
The Five Year Trend Report for EN Set of Books displays values by fiscal year for the 5 years prior to the end date selected in the selection criteria but shows the book values amounts where the values do not tend to change over time.
The pledge summary report contains pledge details, when they are known and transferred into OBI. Based on pledge number and associated name, the report shows original pledge amount, current pledge amount, pledge paid and anticipated remaining amount. These numbers should be taken as estimates only and confirmed with the Office of Development.
Understanding the Data
Note that EN set of books only exists for endowments while SU set of books exists for all funds. SU is the expendable or income value while EN is the endowment or book value. There is also a market value for EN sets of books shown in the Endowment and Donor tab. For additional information about endowments and the difference between SU and EN set of books, refer to Topic Overview: Endowments.
Additional Resources
- For a list of fields available to include in report customizations, refer to Data Fields Available in RFM Dashboard.
- To understand how object codes roll up into higher level groupings, refer to RFM Object Code Rollups.
Award Attributes
Review award attributes including organization, name, status, type, purpose, owner, manager and relevant dates.
Sample Business Questions
- Who is the award owner and award manager and what are the award start and end dates?
- For an award, what is the award name, award type and purpose codes, award org code and award funding source?
Selection Criteria
- To retrieve results, be sure to follow the Selection Criteria instructions near the top of the screen. Refer to Using Selection Criteria for OBI Reports for more guidance.
- For a list of the RFM common selection criteria, their associated list of values and when to use them, refer to RFM Selection Criteria List of Values.
- To view current open awards, select Active from Award Status Description.
Report Views
Understanding the Data
To learn more about the different award/fund types, refer to Topic Overview: Fund Types.
Fund Statement
The fund statement report shows the beginning balance, transactional activity and ending balance for a fund as recorded in Oracle General Ledger (GL). The fund report is typically used for non-sponsored and non-capital awards and includes both the EN (endowment principal) & SU (Stanford operations) journal ledger code (aka set of books).
Demo of Fund Statement report within the RFM Dashboard in OBI
When to Use a Fund Statement
At Stanford, funds are established to track the source and use of money. Fund reports are a tool designed to facilitate the management of these monies. These reports show both inflows (receipts, transfers in) and outflows (transfers out and expenses) and thus help determine how much money is left to spend (Available Balance). These reports help us fulfill our fiduciary responsibilities to donors and others by allowing us to report to the donor on the use of their gift. For more details, refer to Topic Overview: Life Cycle of a Fund.
Fund reports are intended to be used for non-sponsored and non-capital awards as the reports are designed around a fiscal year concept rather than a project-to-date concept.
Sponsored and capital project activities are better managed with project-to-date expenditure reports. Also, certain accounting treatment and relationships in sponsored and capital projects are not completely captured in a single fund and can be spread among multiple funds.
Sample Business Questions
- What was my beginning balance for my award(s) at a point in time?
- What is my ending balance and available balance?
- What is my projected payout and year end balance for my endowments?
- What were the net revenues, transfers and expenses on my award(s) over a user-specified period or P/FTD?
Selection Criteria
To retrieve results, follow the Selection Criteria instructions near the top of the screen. Refer to Using Selection Criteria for OBI Reports for more guidance.
- Using time period selection of First and Last GL Period means that the beginning balance and ending balance align with the period selections. Choosing Fiscal Year To Date means the beginning balance is as of September 1 of the fiscal year of the selected GL Period.
- Select the Last Closed GL Period or earlier. Entering future GL periods produce results that are difficult to interpret.
- Using Object Code selection criteria from the Next section affects balance amounts so that they no longer reflect the entire fund balance and affects formatting in unusual ways.
Using additional selection criteria, in the last column after selecting the Next button, may affect the Fund Balance and Available Balance displayed in the Fund Statement report. These fund balances are calculated using the data that has been returned based on the selection criteria entered when running the report. Restricting transactions by object code or object code groupings may prevent calculating the fund's true Fund Balance and Available Balance.For a list of the RFM common selection criteria, their associated list of values, definitions and when to use them, refer to RFM Selection Criteria List of Values and Definitions.
Report Views
The Fund Statement has five report sections that selectively focus on:
- Stanford University (SU) journal ledger code which shows funds that are available to spend on current/future activities and includes endowment income. These are displayed in a summary section and a detail section.
- Endowment (EN) journal ledger code which shows the principal balances that are held in perpetuity and invested. These are also displayed in a summary section and a detail section.
- Anticipated endowment payouts.
Fund Statement Calculations and Conventions
The Fund Statement captures the equity, activity and balances associated with a single award. Activities that typically increase the balance are designated in the reports as positive values and activities that typically decrease the balance are designated as negative values displayed as red and within parentheses.

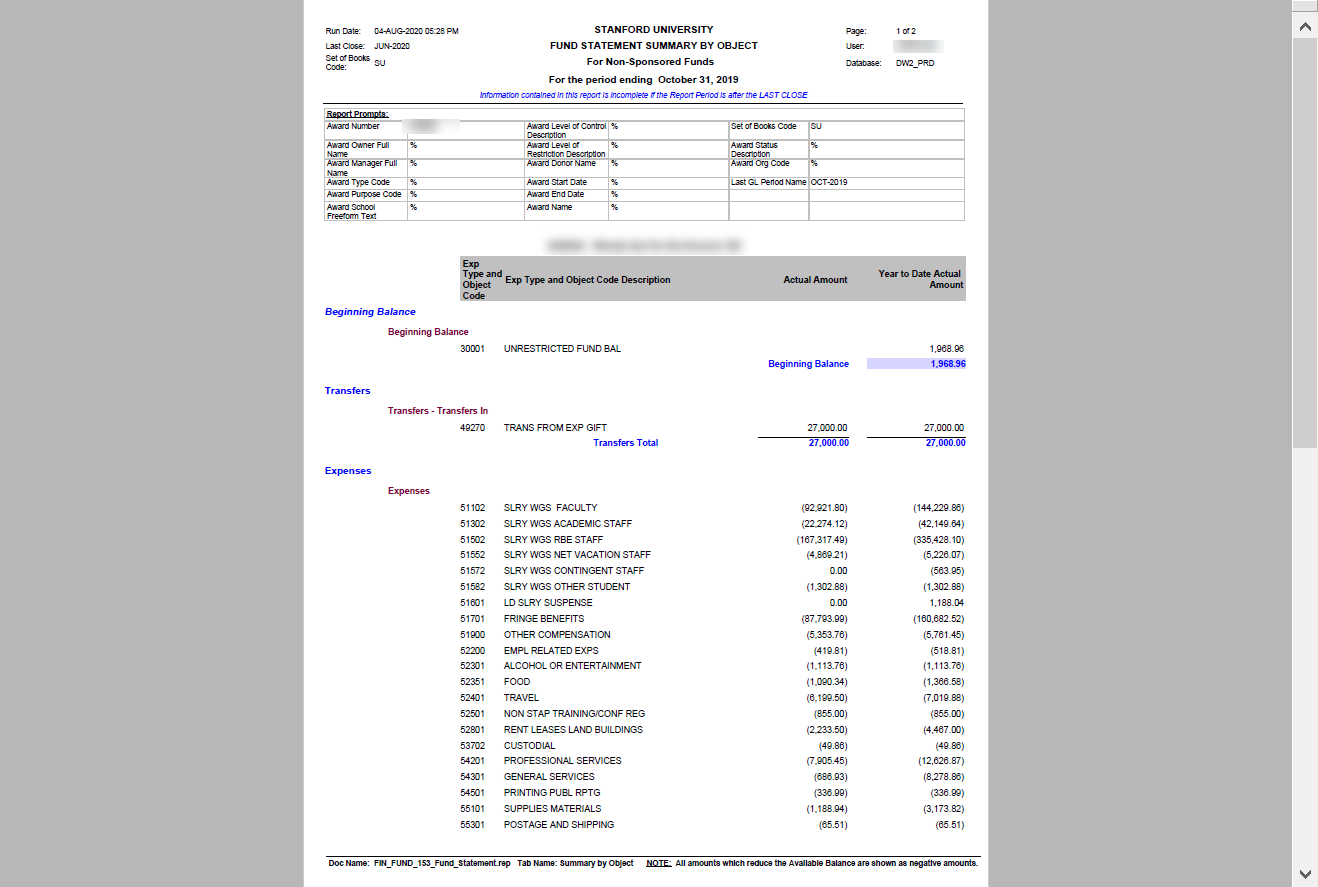
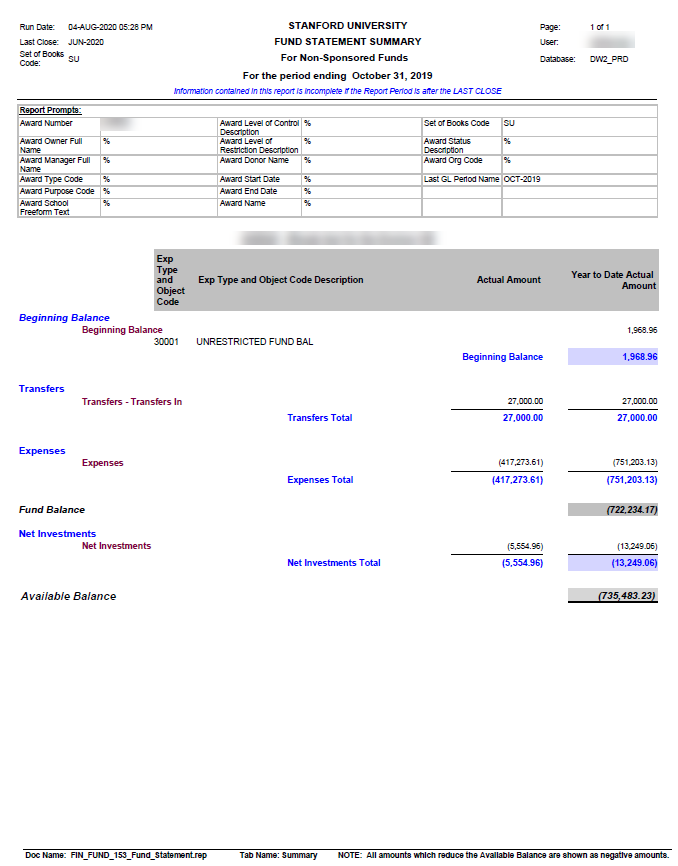
SU Fund Statement Summary
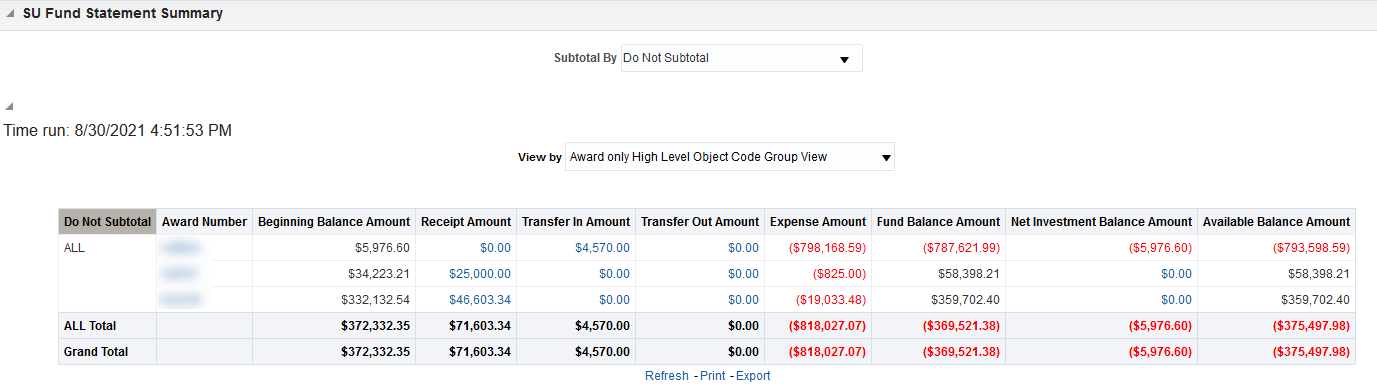
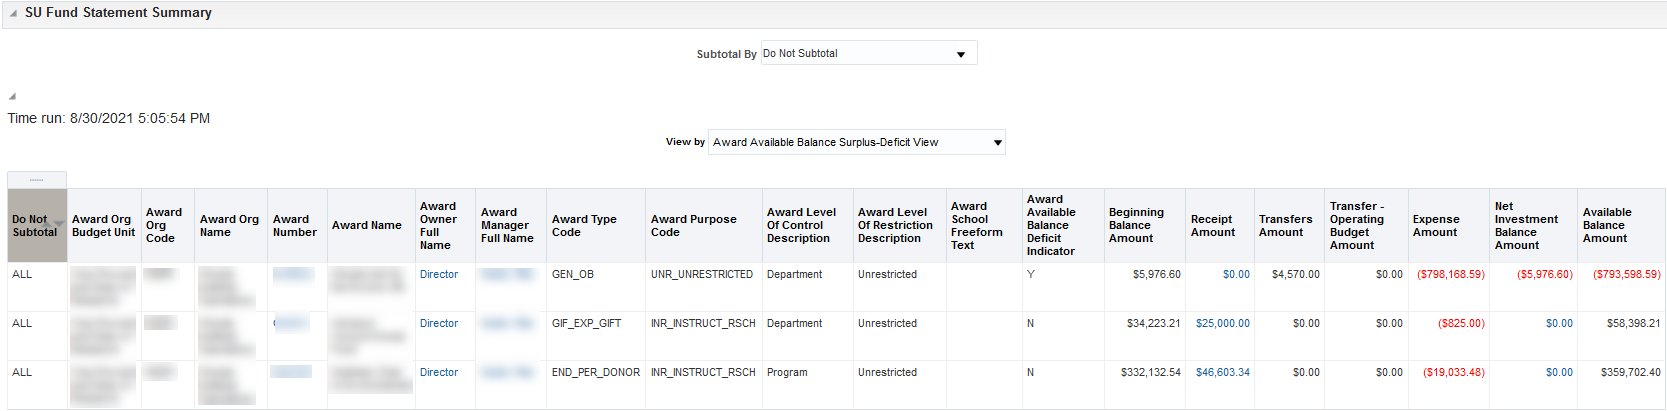
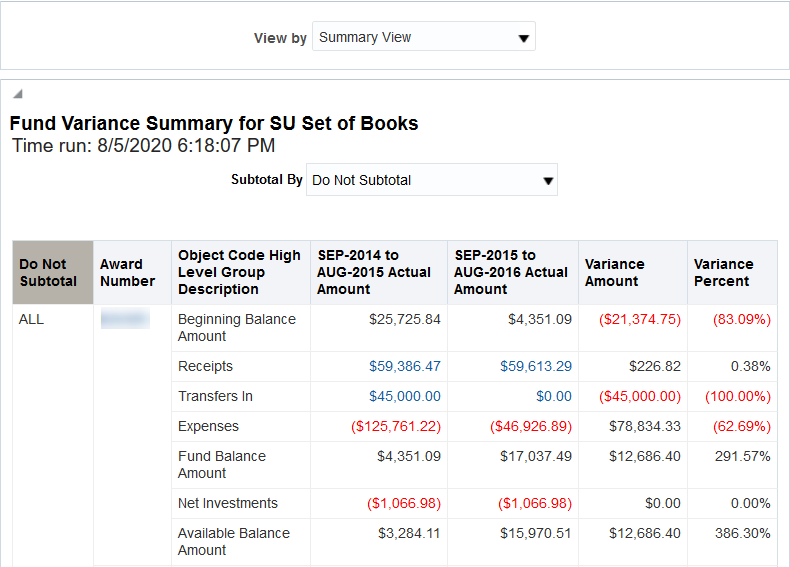
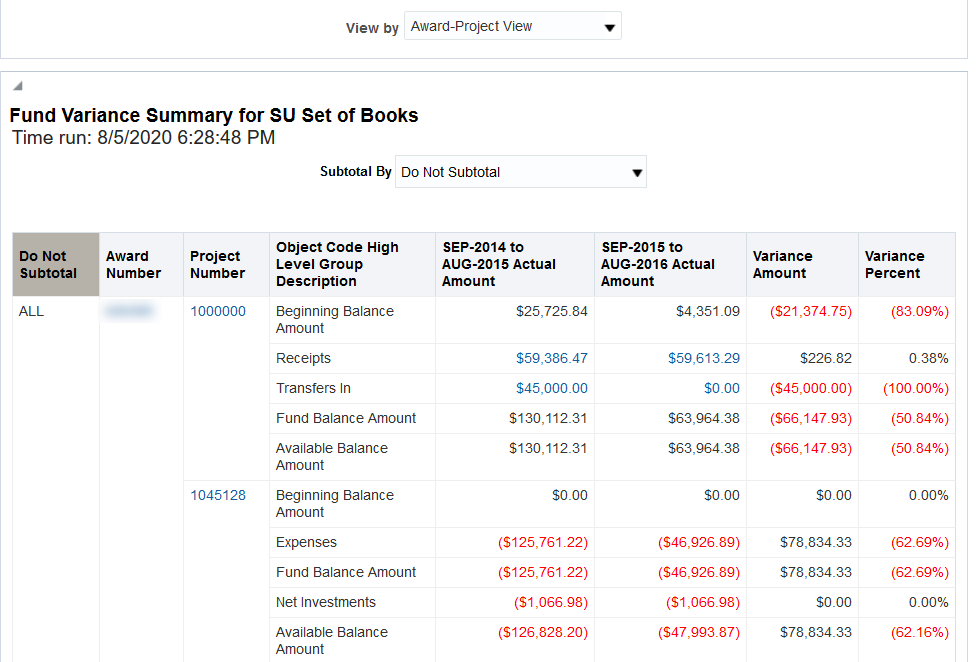
The SU Fund Statement Summary displays beginning balance and totals of receipts , transfers in/out, expenses, net investments, and the calculation of the available balance for the fund(s) for a reporting period. You can choose to display the data by award or award-project, along with different levels of object code rollup detail. Drilling on a hyperlinked value in a summary report opens a new tab that displays a fund statement detail report. Refer to the following screenshots for report examples.
Summary reports include awards with either a beginning balance or activity but does not show awards with no balance and no activity. The Inactive Awards report shows awards with no activity whether they have a balance or not. Awards with zero balance and no future planned activity should be closed. Refer to Topic Overview: Life Cycle of a Fund/Closing the Fund
Displays a consolidation of all awards for the selection criteria entered.
Displays balances and activity for awards at the high level object code level.
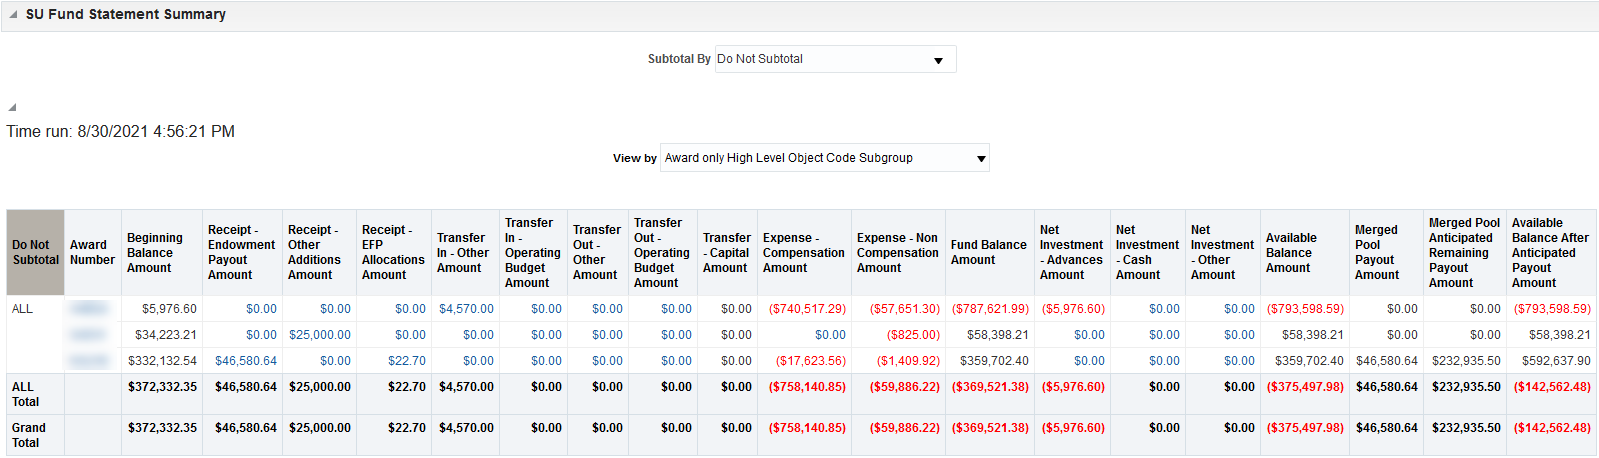
Displays balances and activity for awards at the more granular object code subgroup level.
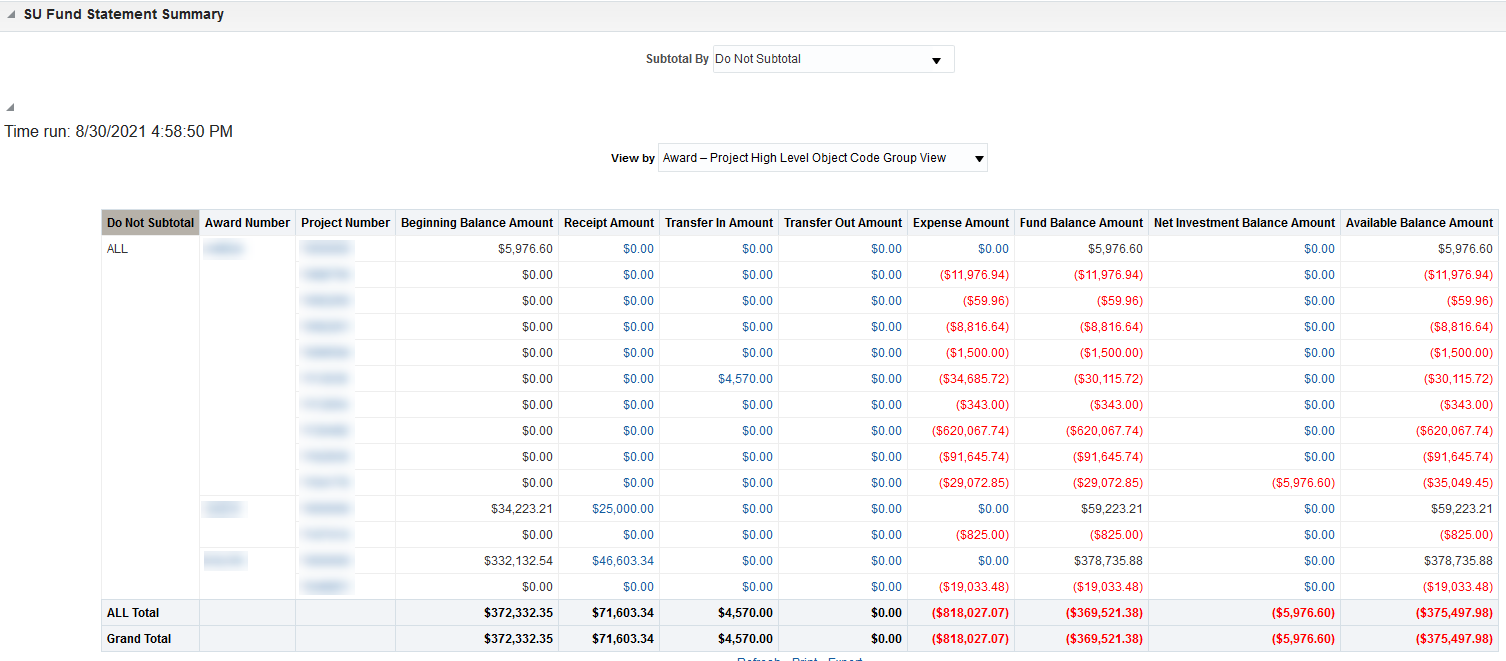
Displays balances and activity for awards and projects at the high level object code level.
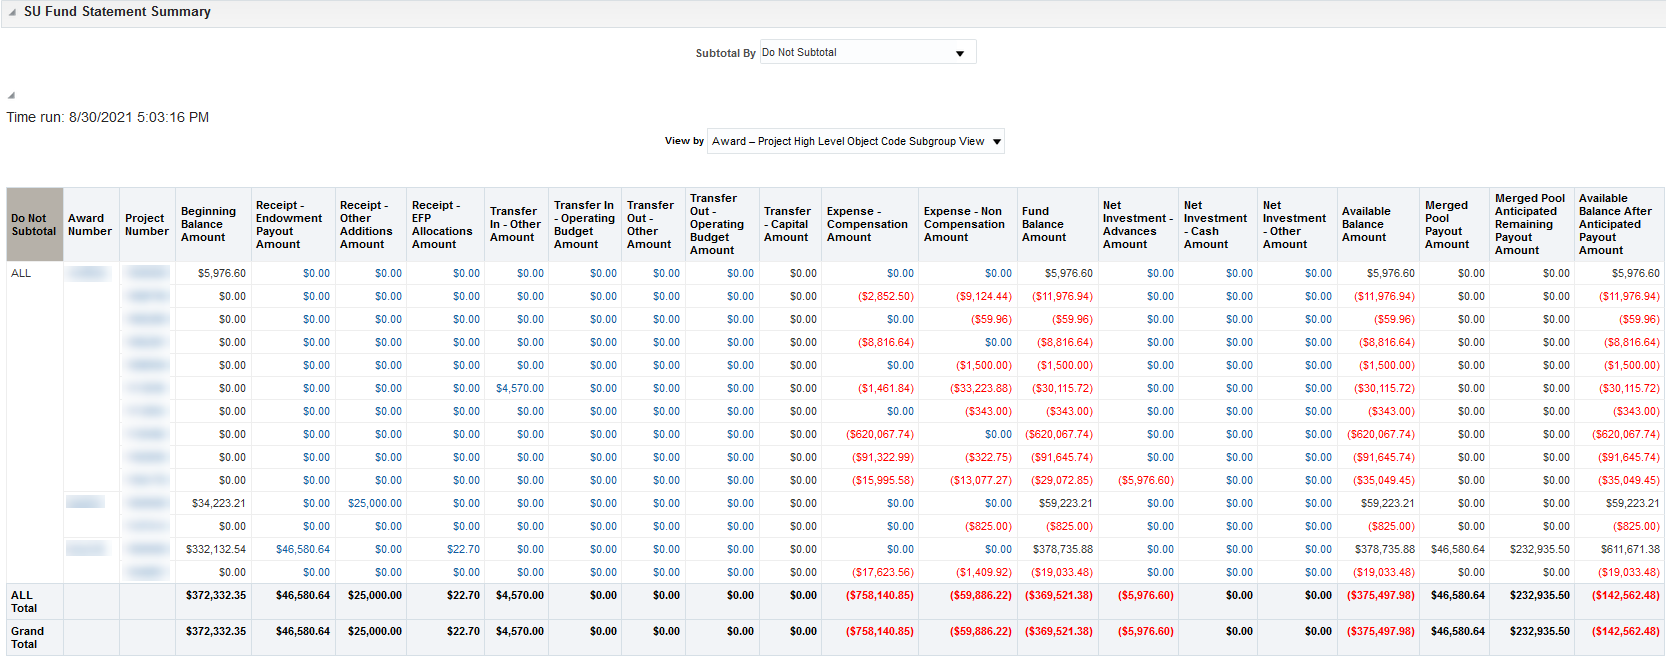
Displays balances and activity for awards and projects at the more granular object code subgroup level.
In addition to amounts at the high level object code group level, displays award configuration details and a Y/N column deficit indicator.
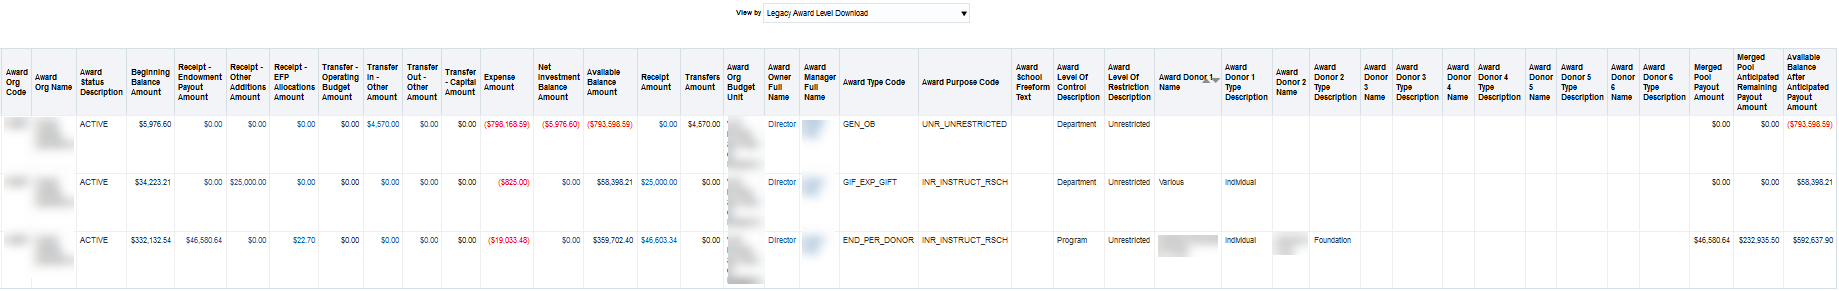
Legacy view displays columns in the same sequence as RM3 for exporting to use in Excel.
EN Fund Statement Summary
The EN Fund Statement Summary has the same characteristics as the SU Fund Statement Summary but only reports on endowment funds .
Balances are for the book value (principal) rather than market value.
Fiscal Year Merged Pool Anticipated Payout Summary
Displaying endowment funds only, this section shows current balance, payout to date, anticipated payout for the rest of the year and anticipated balance after all payout is received. The numbers shown are a projection for planning purposes only and not a guarantee of future payout or return.
If this last amount is negative then the fund is projected to be overspent at fiscal year end after all payout is received and expenses should be journaled off to avoid overdraft.
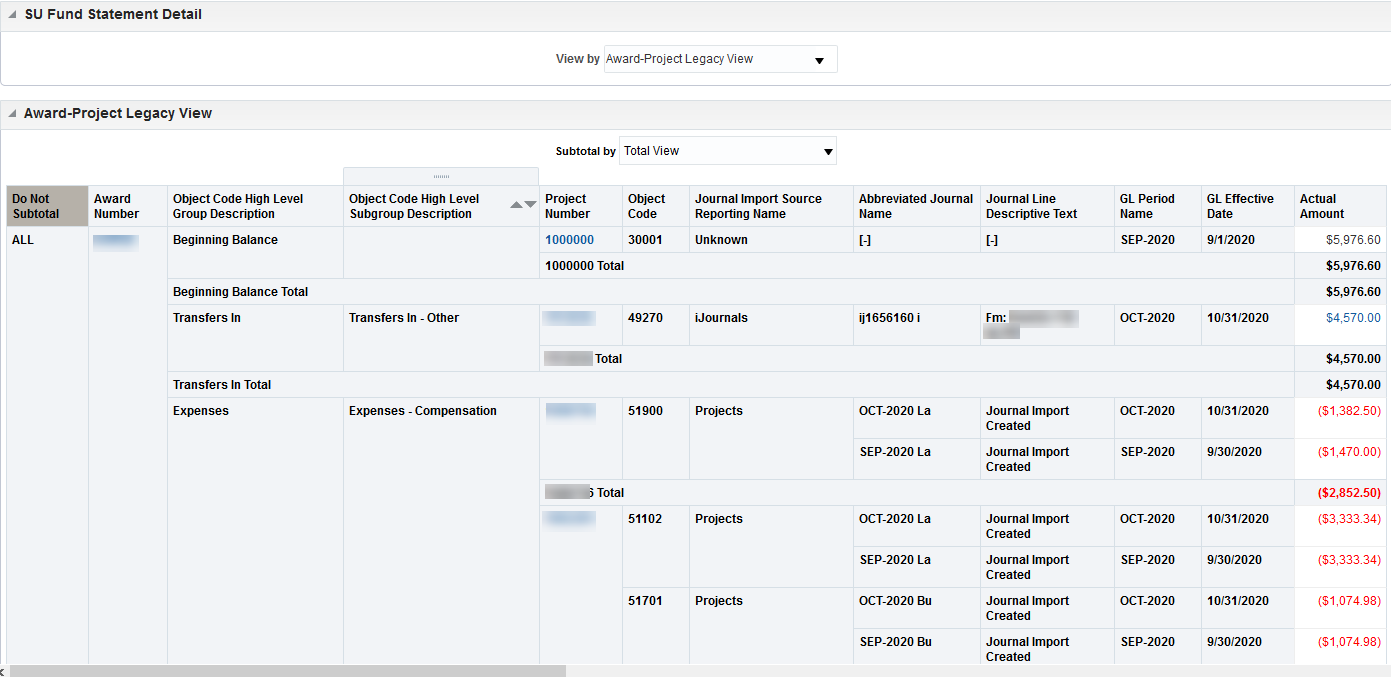
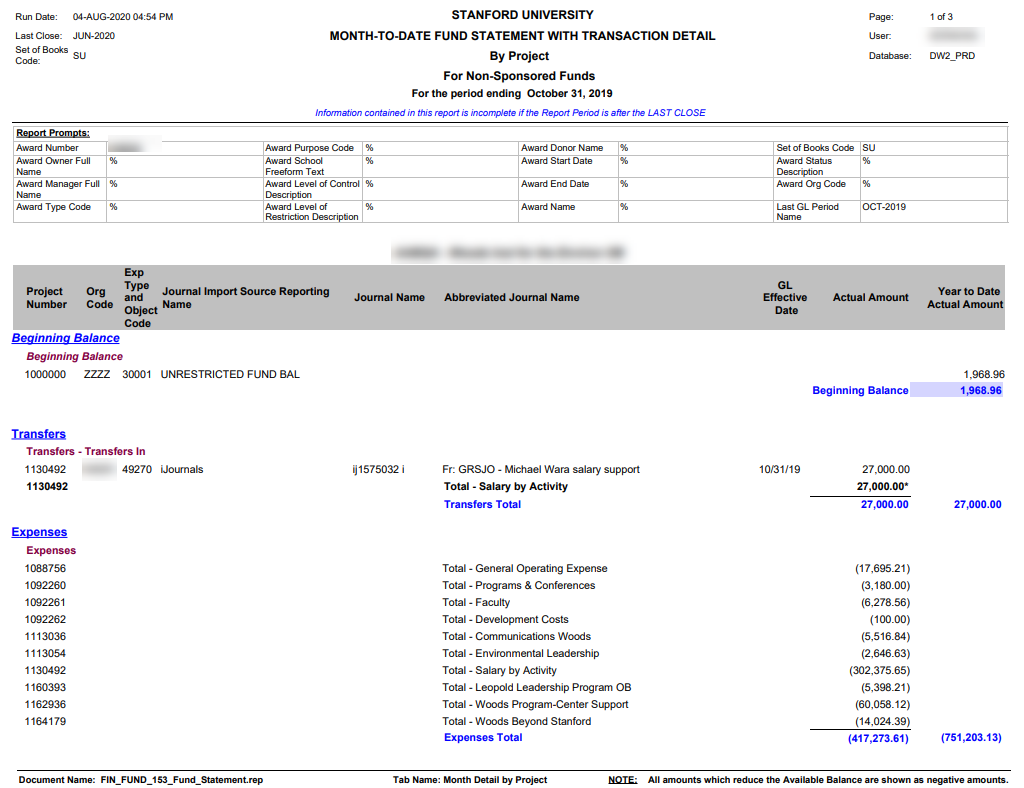
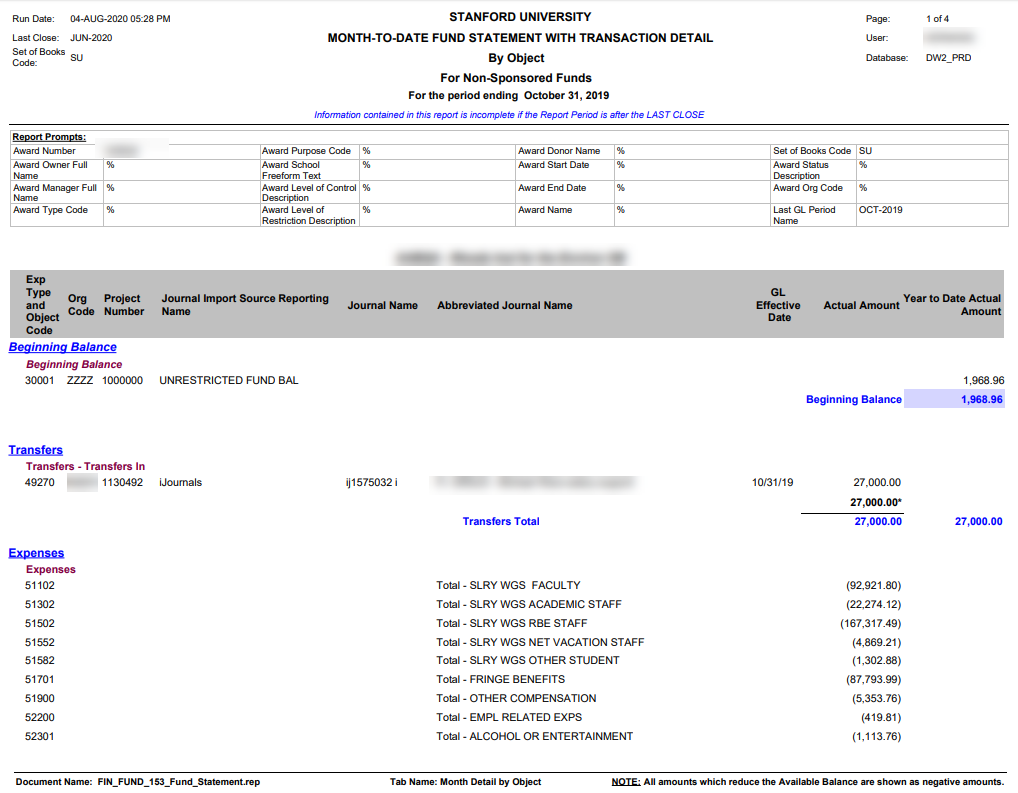
SU Fund Statement Detail
The SU Fund Statement Detail displays the details that make up the values displayed in the SU Fund Statement Summary, including object codes, journal information and GL period.
EN Fund Statement Detail
The EN Fund Statement Detail report provides equivalent information for the EN journal ledger code (aka set of books) where balances reflect book value rather than market value.
The table below has the definitions for the terms listed in the Fund Statement.
| Category | Definition | Object Code |
|---|---|---|
| Beginning Balance | Represents the Award’s equity, or fund balance, at the beginning of the fiscal year. Most funds allow rollover of prior year balances. | 3XXXX |
| Receipts | Represents receipts or revenue earned during the year. Sources include gifts, fees, endowment payout and Expendable Funds Pool (EFP) earnings. | 40000-48999 |
| Transfers |
Represents monies transferred into or out of the Award. Fund Transfers may be to or from Operating Budget (OB); to or from other departments or funds; or related to purchases of capital equipment. For capital equipment, the purchasing fund contributes the asset to the university’s fixed asset fund via a capital transfer generated by the Controller’s Office. Refer to Capital Assets on OBI Expenditure and Fund Reports. |
49XXX |
| Expenses |
Represents expenses of the Award. Reflects monies spent to pay salaries or purchase goods and services. Expenses are updated daily to GL from GA (Grant Accounting) and are shown on the fund reports summarized to the appropriate 5XXXX object code, which corresponds to the expenditure category code. Details of these items are available in the expenditure reports. (Expense details can also be found by iterative drilling on the dollar amounts on the fund statement.)
|
5XXXX |
| Fund Balance | Represents the fund balance at a point in time, factoring in revenue, transfers and expenses, but does not take into account encumbrances that are reflected in Net Investments. | No object code displayed |
| Net Investments | Represents all assets and liabilities owned by the Award except for cash (object code 11050). May include advances, inventory, prepaids and/or payables. Balances from previous periods/years will carry forward until resolved. | 1XXXX and 2XXXX, except for cash |
| Available Balance |
Represents the cash or unspent money remaining in the fund that is available for use. Available Balance takes into account monies which are not available to be spent as they are currently being used for other purposes and are reflected as other assets or liabilities.
|
No object code displayed |
The table below explains the columns displayed in Fund Statement Details section of the fund statement report.
| Column Name | Description/Additional Information |
|---|---|
| Object Code | Represents the object code associated with the transaction. For full lists see Topic Overview: Find Existing Object Codes |
| Project Number |
Represents the project associated with the transaction. Project 1000000 is the generic project for the award and is where:
|
|
Source
|
Indicates the Oracle module/subledger where the transaction originated. Listed below are some of the more common sources with associated Journal Import Category of transactions.
|
|
Journal
|
Provides further information to identify the nature of the transaction.
Drilling into the dollar amount provides additional details. |
| Description (Journal Line Descriptive Text) | Explains more information about the transaction (e.g. GL journal description) |
| GL Period | Which fiscal period it was posted to Oracle General Ledger |
| Actual Amount | The dollar amount of the transaction or aggregate transaction amount |
Expenditures are rolled up to the expenditure category level from the Grants Accounting (GA) module and update/import system journals daily into GL (designated as Journal Import Created) that are consolidated as a single value per month per object code. Other journals are shown as individual transaction lines.
Drilling provides additional information and often drilling on drills is required to answer a question. For example, to see the expense request number that cleared a Net Investment balance you would need to drill on the actual amount in the fund statement which would reveal a Journal Import transaction. Drilling on the actual amount for a journal transaction detail will open an AP Invoice Details report showing the expense request number and business purpose.
Note: You are unable to drill into the Journal Import Header actual amounts displayed at the top, but can typically drill on the Journal Transaction Details.
For additional information regarding fund statements refer to the resource documents specific to the Revenue and Fund Management Dashboard listed on System: OBI Financial Reporting - Resources:
- Data Fields Available in RFM Dashboard
- Endowment Glossary
- RFM Selection Criteria List of Values and Definitions
- RFM Object Code Rollups
- Capital Assets on OBI Expenditure and Fund Reports
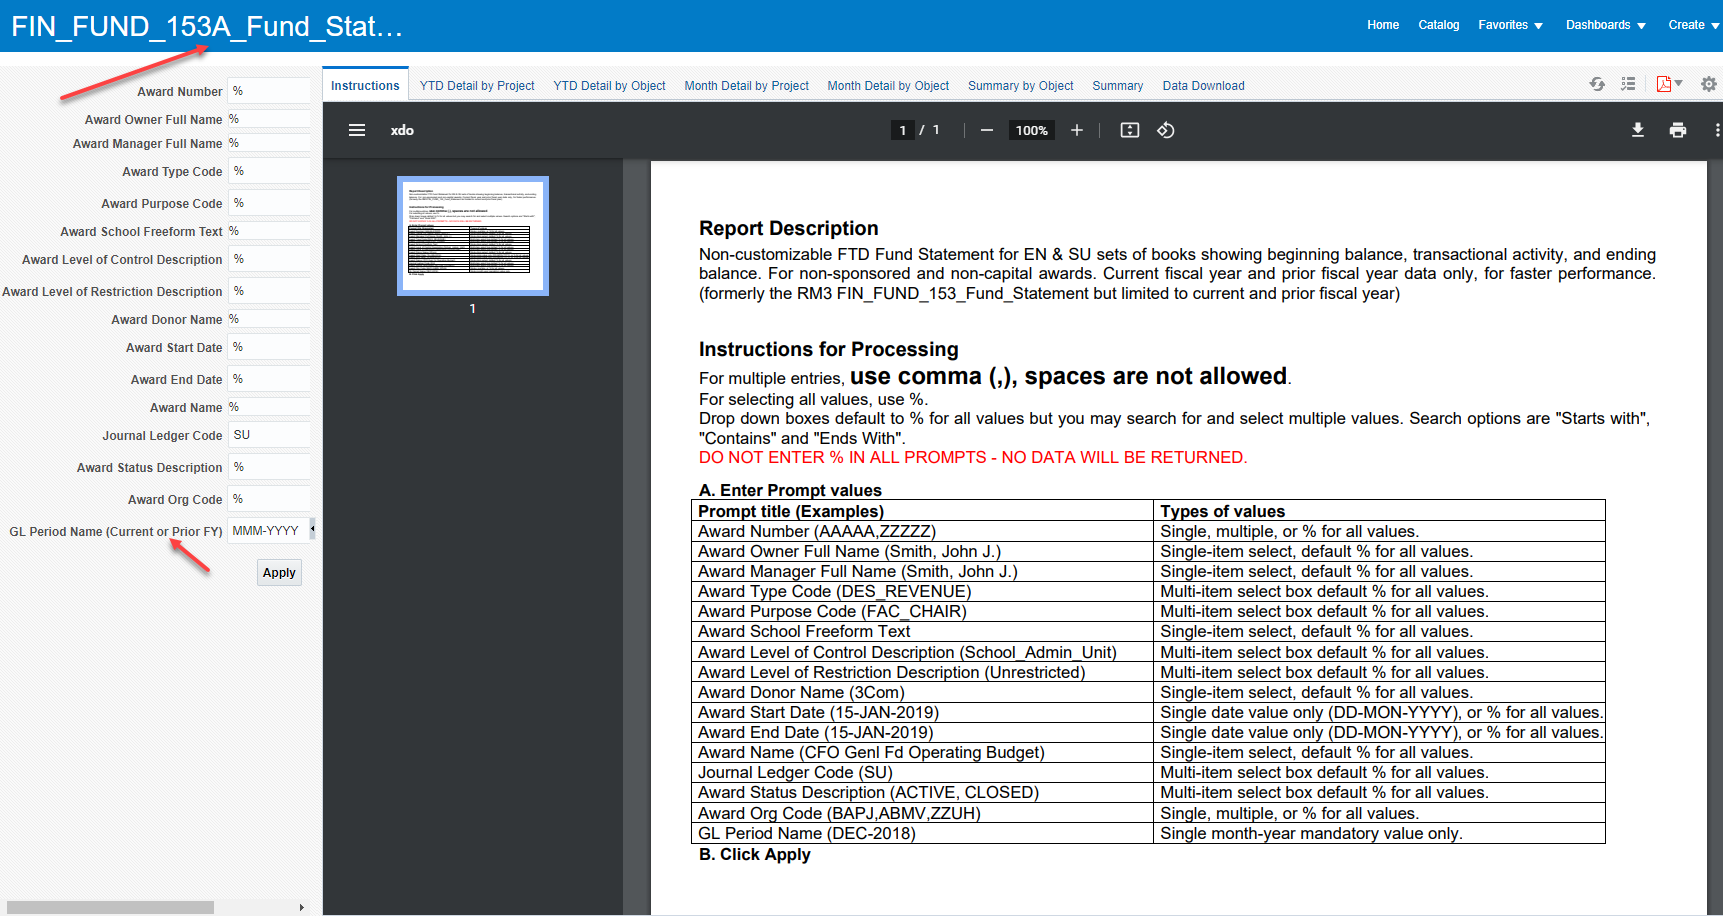
Fiscal to Date Fund Statement (Current year and prior year only)
Non-customizable FTD Fund Statement for EN & SU sets of books showing beginning balance, transactional activity, and ending balance. For non-sponsored and non-capital awards. Current fiscal year and prior fiscal year data only, for faster performance. (formerly the RM3 FIN_FUND_153A_Fund_Statement but limited to current and prior fiscal year)
Launch OBI Fiscal to Date (FTD) Fund Statement (Current and prior year only)
Sample Business Questions
- What are the GL details affecting my awards?
- What GL transactions occurred in the last month?
- What are my balances in the GL?
Selection Criteria
- The Selection Criteria section is located on the left hand side of the screen. Instructions are on the first tab.
- For additional information, refer to BI Publisher Reports.
- For a list of the RFM common selection criteria, their associated list of values and when to use them, refer to RFM Selection Criteria List of Values.
- The GL Period Name is a required field and the GL Period Name must be in the Current Fiscal Year or Prior Fiscal Year to get results
- Use Journal ledger code = SU for expendable accounts and = EN for endowment principle accounts. An endowment fund has both SU and EN accounts while other funds types only have SU.
When reporting on endowment funds, the last closed GL period name must be used for the display of the Anticipated Endowment Payout report section.
Report Views
Fiscal to Date Fund Statement report tabs show key information about fund statement values like balances, inflows and outflows. Reports can be viewed on screen and downloaded as PDF or Excel files. There are seven different report views on different tabs:
If any of the report tabs and menu controls are missing, your window is too narrow. Expand the width or decrease the browser Zoom (control-minus).
Understanding the Data
For additional information, refer to RFM Resources in System: OBI Financial Reporting.
Fiscal to Date Fund Statement
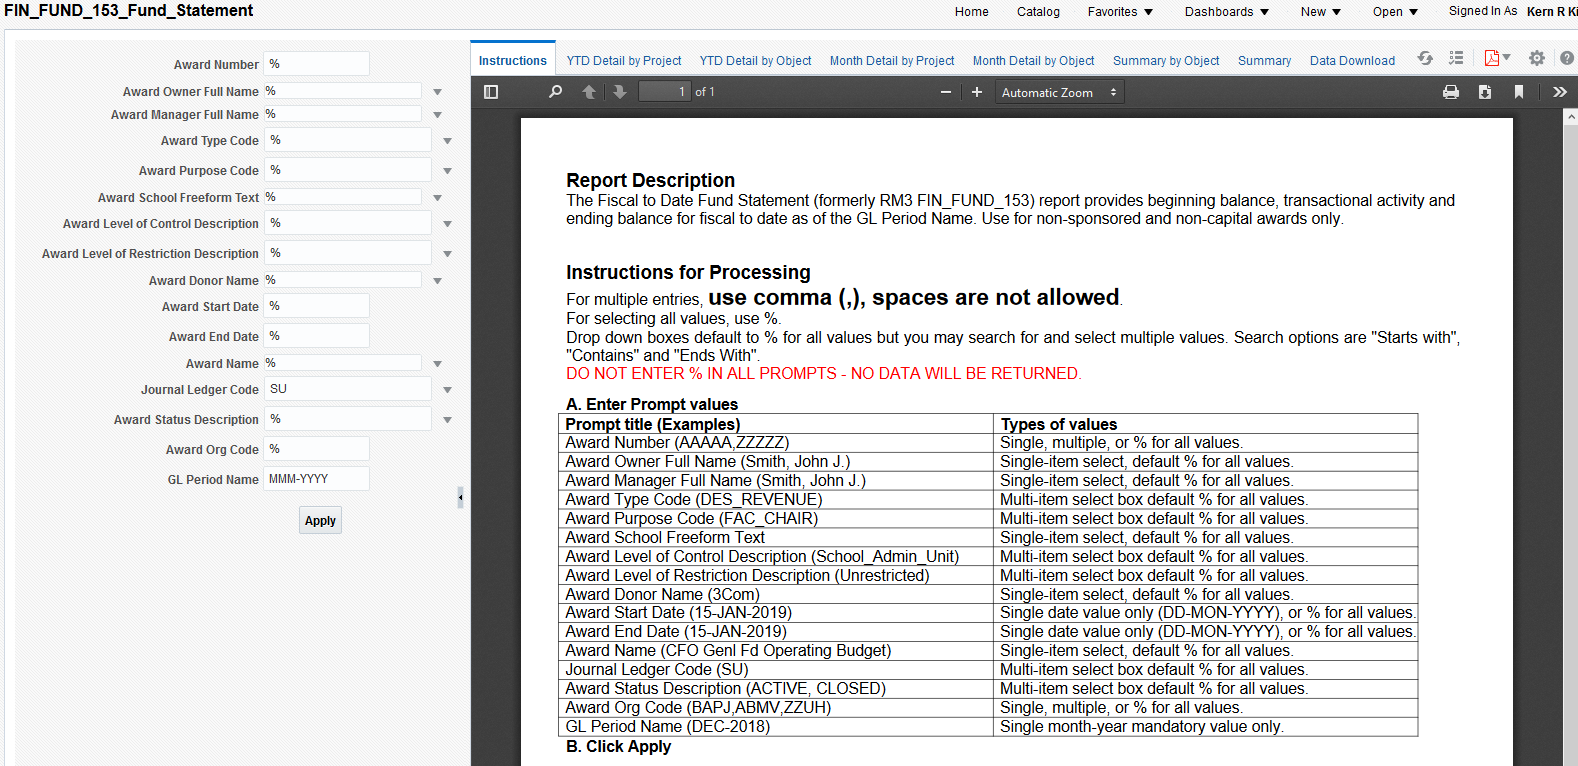
Non-customizable, BI Publisher report, FTD Fund Statement for EN & SU sets of books showing beginning balance, transactional activity and ending balance. For non-sponsored and non-capital awards. (formerly the RM3 FIN_FUND_153_Fund_Statement). Equivalent to the dashboard Fund Statement report
Sample Business Questions
- What are the GL details affecting my awards?
- What GL transactions occurred in the last month?
- What are my balances in the GL?
Selection Criteria
- The Selection Criteria section is located on the left hand side of the screen. Instructions are on the first tab.
- For additional information, refer to BI Publisher Reports.
- For a list of the RFM common selection criteria, their associated list of values and when to use them, refer to RFM Selection Criteria List of Values.
- The GL Period Name is a required field.
- Use Journal ledger code = SU for expendable accounts and = EN for endowment principle accounts. An endowment fund has both SU and EN accounts while other funds types only have SU.
When reporting on endowment funds, the last closed GL period name must be used for the display of the Anticipated Endowment Payout report section.
Report Views
Fiscal to Date Fund Statement report tabs show key information about fund statement values like balances, inflows and outflows. Reports can be viewed on screen and downloaded as PDF or Excel files. There are seven different report views on different tabs:
If any of the report tabs and menu controls are missing, your window is too narrow. Expand the width or decrease the browser Zoom (control-minus).
Understanding the Data
For additional information, refer to RFM Resources in System: OBI Financial Reporting.
Award Status Fund Statement
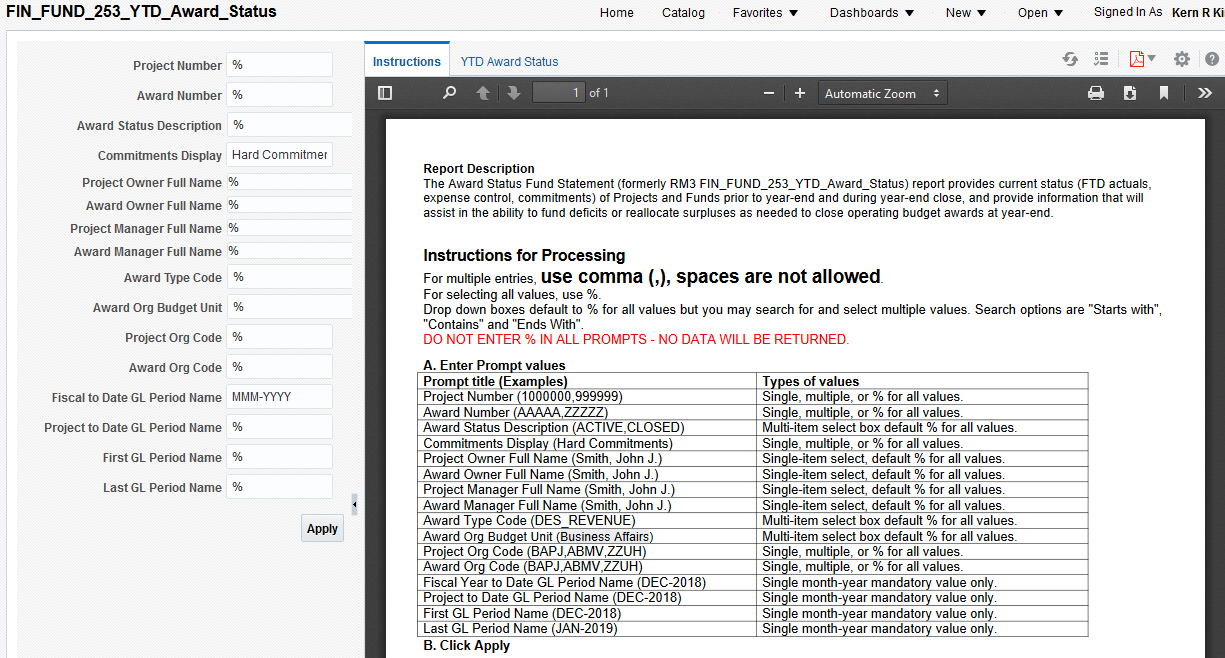
Non-customizable, BI Publisher report, Award Status Fund Statement (formerly RM3 FIN_FUND_253_YTD_Award_Status) report provides current status (FTD actuals, expense control, commitments) of projects and funds prior to year-end and during year-end close. The report also provides information that will assist in the ability to fund deficits or reallocate surpluses as needed to close operating budget awards at year-end.
Sample Business Questions
- What are my account balances, especially those in overdraft?
- What are my variances between budget and actual?
- What are my actual transaction totals and commitments year to date?
- What are my balances and transaction totals for a range of GL Periods?
Selection Criteria
- The Selection Criteria section is located on the left hand side of the screen. Instructions are on the first tab.
- For additional information, refer to BI Publisher Reports.
- For a list of the RFM common selection criteria, their associated list of values and when to use them, refer to RFM Selection Criteria List of Values.
- A GL Period perspective must be entered. Choose either Fiscal Year to Date, Project to Date or both a First GL Period and a Last GL Period.
Report Views
This report assists in year end close processes by showing projected balances.
Understanding the Data
For additional information refer to documents in the RFM section of resources in System: OBI Financial Reporting.
Operating Statement and Clinical Trials Statement
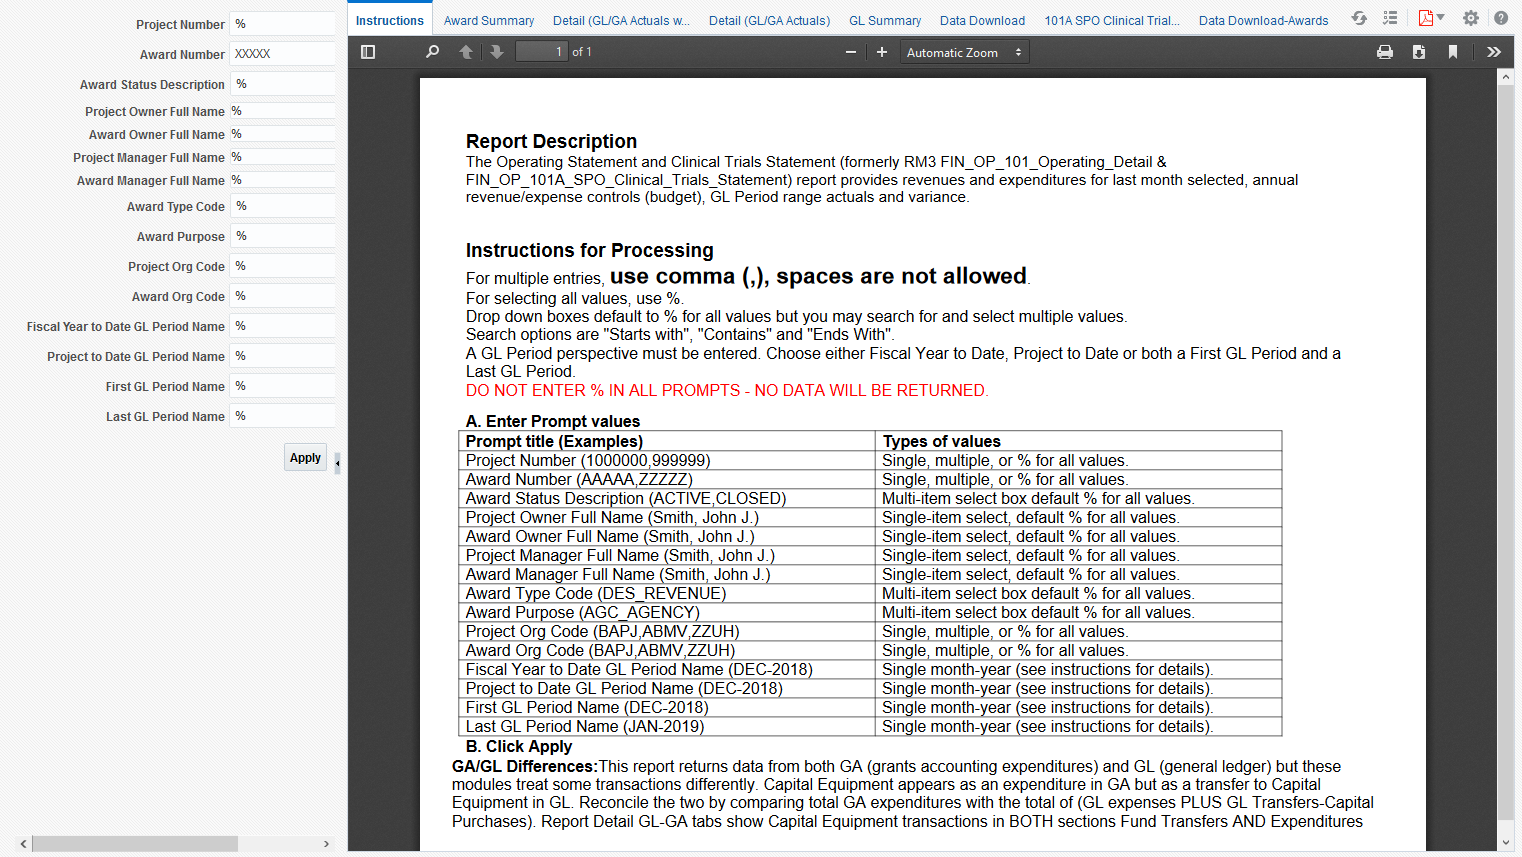
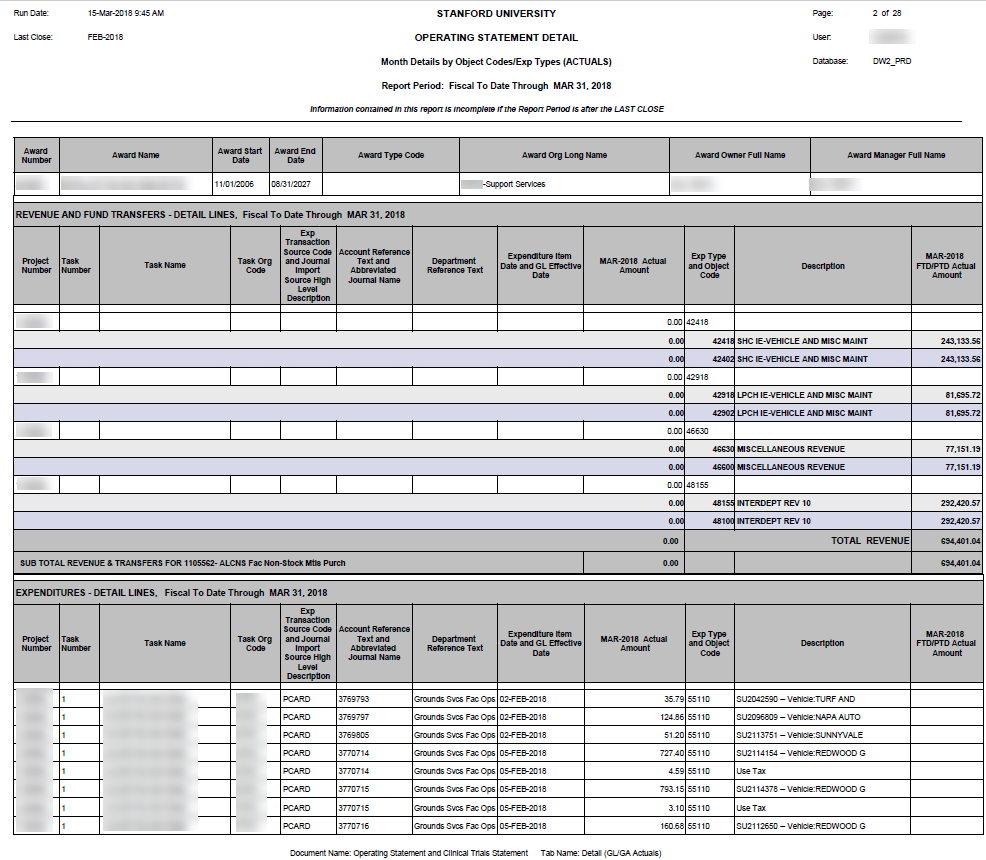
Non-customizable, BI Publisher report, Operating Statement and Clinical Trials Statement (formerly RM3 FIN_OP_101_Operating_Detail & FIN_OP_101A_SPO_Clinical_Trials_Statement) report provides revenues and expenditures for last month selected, annual revenue/expense controls (budget), GL Period range actuals and variance.
Launch OBI Operating Statement and Clinical Trials Statement
Sample Business Questions
- As a Service Center org what is my break even between revenue and expense?
- What is the reconciliation between GA and GL?
Selection Criteria
- The Selection Criteria section is located on the left hand side of the screen. Instructions are on the first tab.
- For additional information, refer to BI Publisher Reports.
- For a list of the RFM common selection criteria, their associated list of values and when to use them, refer to RFM Selection Criteria List of Values.
Report Views
Operating Statement and Clinical Trials Statement report tabs show details from both GA and GL in a single report and facilitate GA/GL reconciliation. There are seven different report views on different tabs:
- Award Summary
- Detail (GL/GA Actuals with Budget)
- Detail (GL/GA Actuals)
- GL Summary
- Data Download
- 101A SPO Clinical Trials
- Data Download-Awards
If any of the report tabs and menu controls are missing, your window is too narrow. Expand the width or decrease the browser Zoom (control-minus).
This is the third of seven possible report views.
Understanding the Data
For additional information refer to RFM Resources in System: OBI Financial Reporting.
GL Journal Details
This report returns details of GL journal transactions. (similar to RM3 161, 162 and 252 reports).
Sample Business Questions
- Which journals have posted to my PTA?
- Which journals filtered specific parameters (e.g., Receipts - EFP Allocations) have posted?
Selection Criteria
- To retrieve results, be sure to follow the Selection Criteria instructions near the top of the screen. Refer to Using Selection Criteria for OBI Reports for more guidance.
- For a list of the RFM common selection criteria, their associated list of values and when to use them, refer to RFM Selection Criteria List of Values.
Report Views
For examples of the reports available, view the screenshots below:
Understanding the Data
- For a list of fields available to include in report customizations, refer to Data Fields Available in RFM Dashboard.
- To understand how object codes roll up into higher level groupings, refer to RFM Object Code Rollups.
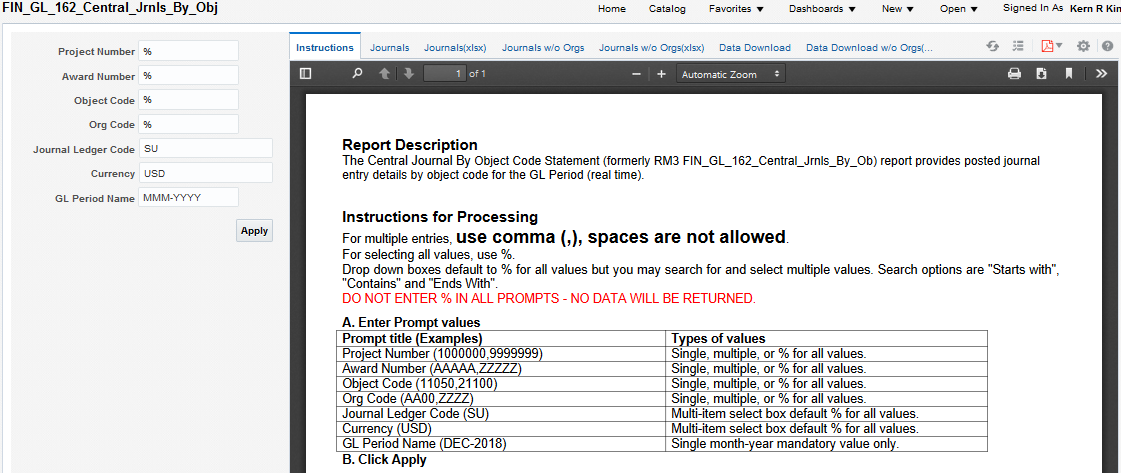
Posted Journals by Object Code (Real-time)
Non-customizable, BI Publisher report, Posted Journals by Object Code report displays the posted journal line detail for a single period and given PFOO. (formerly the RM3 FIN_GL_161_Post_Jrnl_By_Obj_Code and RM3 FIN_GL_162_Central_Jrnls_By_Obj reports). The primary benefit of this report is that it is real time instead of yesterday’s data.
Sample Business Questions
For a given GL Period and Object Code and PTA perspective, what journals have posted to the live Oracle system (i.e., as of this minute)?
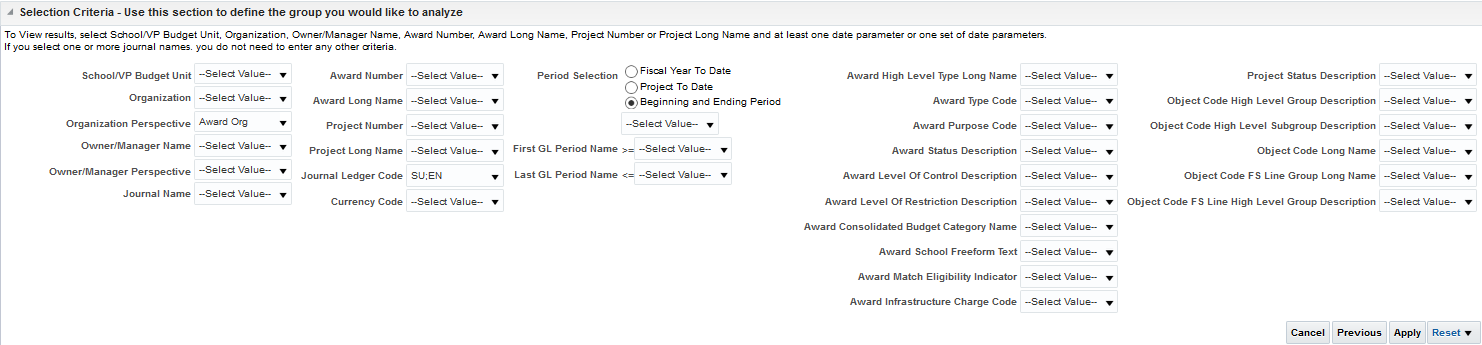
Selection Criteria
- The Selection Criteria section is located on the left hand side of the screen. Instructions are on the first tab.
- For additional information, refer to BI Publisher Reports.
- For a list of the RFM common selection criteria, their associated list of values and when to use them, refer to RFM Selection Criteria List of Values.
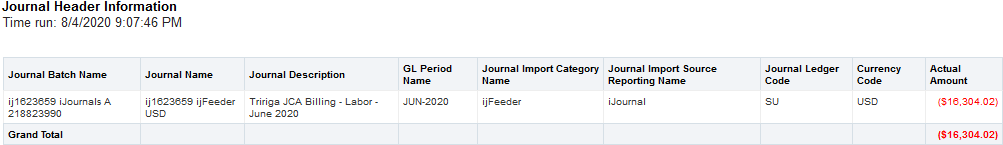
Report Views
Posted Journals by Object Code (real-time) tabs show details of journals posted to the GL. There are six report view tabs:
- Journals
- Journals(xlsx)
- Journals w/o Orgs
- Journals w/o Orgs(xlsx)
- Data Download
- Data Download w/o Orgs(xlsx)
If any of the report tabs and menu controls are missing, your window is too narrow. Expand the width or decrease the browser Zoom (control-minus).
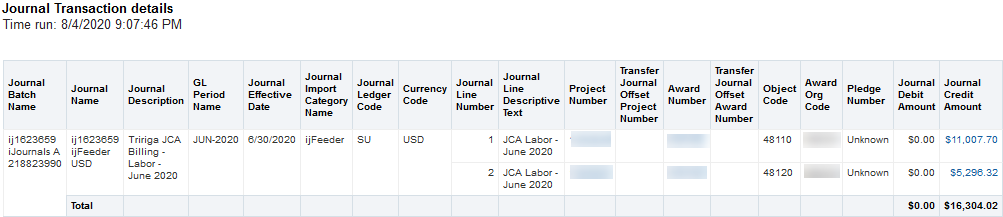
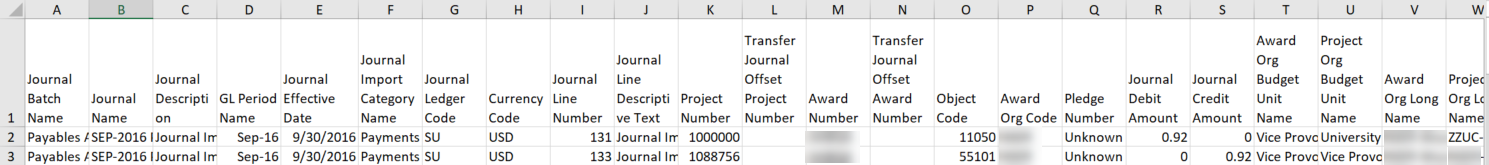
The data download report contains 123 columns of data about each journal transaction.
The other four report tabs are not shown here.
Understanding the Data
For additional information, refer to RFM Resources in System: OBI Financial Reporting.
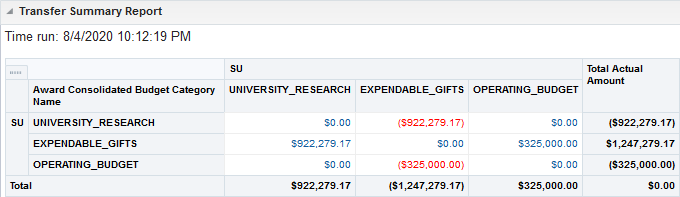
Transfer Summary Report
The Transfer Summary Report shows transfers of funds between awards (object codes 49100 to 49699), displays both to and from awards, projects and related attributes at a summary level in a table with from and to flows displayed at the consolidated budget category level.
Sample Business Questions
At the consolidated budget category level, what are the total transfers to and from my PTA perspective?
Selection Criteria
- To retrieve results, be sure to follow the Selection Criteria instructions near the top of the screen. Refer to Using Selection Criteria for OBI Reports for more guidance.
- For a list of the RFM common selection criteria, their associated list of values and when to use them, refer to RFM Selection Criteria List of Values.
- Data is pulled based on either the From or the To perspective of PTA or org.
Report Views
Understanding the Data
- For a list of fields available to include in report customizations, refer to Data Fields Available in RFM Dashboard.
- To understand how object codes roll up into higher level groupings, refer to RFM Object Code Rollups.
Transfer Detail Report
The Transfer Detail Report shows transfers of funds between awards (object codes 49100 to 49699), displays both to and from awards, projects and related attributes at a detail level, transaction by transaction.
Sample Business Questions
- What are the details of transfers to and from my PTA perspective?
- At year end, what are the details of my transfers in and out during the month of August?
Selection Criteria
- To retrieve results, be sure to follow the Selection Criteria instructions near the top of the screen. Refer to Using Selection Criteria for OBI Reports for more guidance.
- For a list of the RFM common selection criteria, their associated list of values and when to use them, refer to RFM Selection Criteria List of Values.
- Data is pulled based on either the From or the To perspective of PTA or org.
Report Views
For examples of the reports available, view the screenshots below:
Understanding the Data
If you have authority for either the from or the to side of a transfer you will be able to see the transaction based on your side and see the offsetting from or to on the same line; i.e., if your award receives a transfer you will see which award transferred it to you.
Additional Resources
- For a list of fields available to include in report customizations, refer to Data Fields Available in RFM Dashboard.
- To understand how object codes roll up into higher level groupings, refer to RFM Object Code Rollups.
Fund Trend
The Fund Trend Report Fund Statements for EN & SU sets of books showing values over time in user-selectable time periods, includes line graph representations.
Sample Business Questions
- If my inflows and outflows remain consistent with historical trends, how long will my funding last?
- Are the net revenues, transfer and expenses on my award(s) trending up or down?
- Is my balance consistently increasing or decreasing over time?
Selection Criteria
- To retrieve results, be sure to follow the Selection Criteria instructions near the top of the screen. Refer to Using Selection Criteria for OBI Reports for more guidance.
- For a list of the RFM common selection criteria, their associated list of values and when to use them, refer to RFM Selection Criteria List of Values.
Report Views
Choose values of both the View By for trend time period column settings and Subtotal By to choose the dark gray column to show a subtotal.
A similar report is returned for EN set of books but does not have expenses because the endowment principle can not be spent.
The GL Balance Trend Graph for SU Set of Books shows balance amounts for beginning balance, fund balance and available balance. The fund balance for one period carries forward to become the beginning balance for the next period. The available balance is the fund balance adjusted for accrued assets and liabilities; e.g., the fund balance could be reduced by uncleared advances, but the available balance amount does not carry forward to the next period but is instead calculated based on current accruals.
The GL Activity Trend Graph for SU Set of Books shows the trend for things that affect the balance, such as expenses and receipts. Drilling on a data point reveals underlying details and is useful for researching exceptional values.
The GL Activity Trend Chart for SU Set of Books shows the trend in a stacked format to highlight positive and negative influences on the balance and show the net activity amount in the form of a line graph, whose scale is shown on the right side of the graph with generally smaller values than the stacked scale on the left side.
The GL Balance Trend Graph for EN Set of Books shows balance amounts for beginning balance, fund balance and available balance. The fund balance for one period carries forward to become the beginning balance for the next period. The available balance is always zero for the EN set of books (endowment values) because the endowment value is not available for spending by definition.
The GL Activity Trend Graph for EN Set of Books shows the trend for things that affect the balance, such as receipts and transfers (expenses do not exist for the EN set of books as balances cannot be spent). The net investment value is always a negative amount equal to the fund balance so that the sum, or available balance, will be zero. Drilling on a data point reveals underlying details and is useful for researching values.
The GL Activity Trend Chart for EN Set of Books shows the trend in a stacked format to highlight positive and negative influences on the balance and show the net activity amount in the form of a line graph, whose scale is shown on the right side of the graph with generally smaller values than the stacked scale on the left side. Net Activity for EN set of books is mostly meaningless because the convention on available balance washes out other activities.
Understanding the Data
- For a list of fields available to include in report customizations, refer to Data Fields Available in RFM Dashboard.
- To understand how object codes roll up into higher level groupings, refer to RFM Object Code Rollups.
Comparative Trial Balance by Object Code
The Comparative Trial Balance by Object Code report provides the:
- Statement of Position (object codes beginning with 1,2 or 3) which shows the ending balance as of a selected period and the same period of prior year.
- Statement of Activity (object codes beginning with 4 or 5) which shows year-to-date activities for a selected period and the same period of prior year.
Sample Business Questions
- What is my trial balance?
- What is the variance of my Statement of Position between two time periods?
- What is the variance of my Statement of Activity between two time periods?
Selection Criteria
To retrieve results, be sure to follow the Selection Criteria instructions near the top of the screen. Refer to Using Selection Criteria for OBI Reports for more guidance.
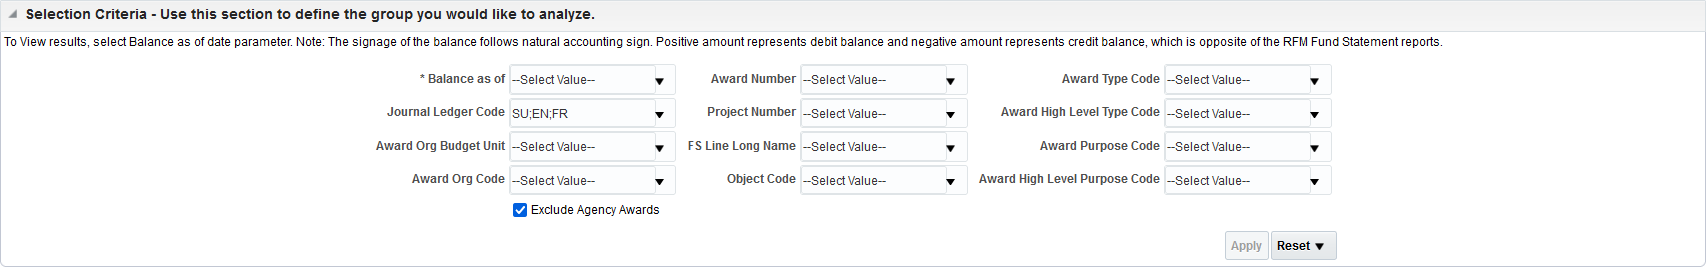
For a list of the RFM common selection criteria, their associated list of values and when to use them, refer to RFM Selection Criteria List of Values.
Report Views
For examples of the reports available, view the screenshots below:
The Statement of Position report shows the current balance of Assets, Liabilities and Net Assets for the specified period and for the Ending Adjustment Period (ADJE) for the prior fiscal year.
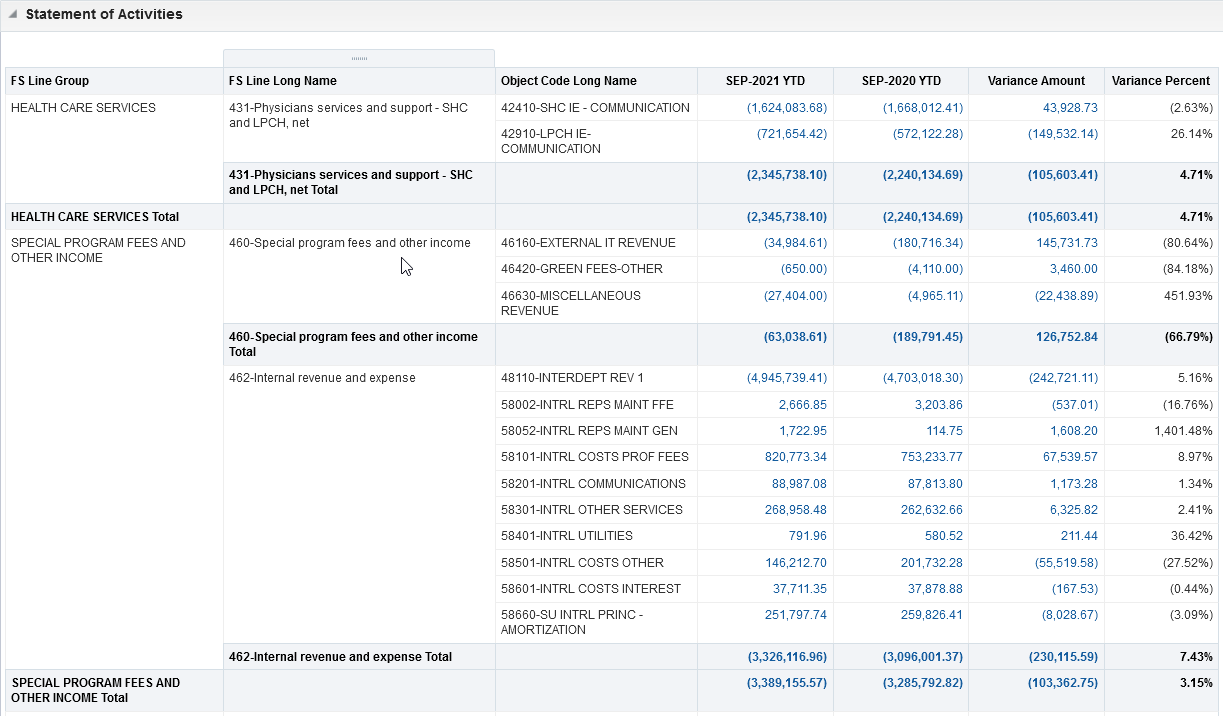
The Statement of Activity report shows the Revenue and Expenses year-to-date for the specified period and year-to-date for the same period from the previous year.
Understanding the Data
The trial balance reports use Stanford’s institutional Object Code FS line (fund statement) rollups.
Additional Resources
- For a list of fields available to include in report customizations, refer to Data Fields Available in RFM Dashboard.
- To understand how object codes roll up into higher level groupings, refer to RFM Object Code Rollups.
Operating Statement Month by Month
BI Publisher, non-customizable, Operating Statement Month by Month Report provides monthly operating statement summary information by award and object code, sectioned by revenue, fund transfers, expenditures, gain/loss and capital transfers. The yearly information also provides summary information on other Assets and Liabilities codes. (formerly FIN_OP_284_Mo_By_Mo _Month-by-Month).
Sample Business Questions
- What is my revenue and expense month by month by object code?
- What are my gains/losses month by month?
- What is my summary information about assets and liabilities?
Selection Criteria
- To retrieve results, be sure to follow the Selection Criteria instructions near the top of the screen. Refer to Using Selection Criteria for OBI Reports for more guidance.
- For a list of the RFM common selection criteria, their associated list of values and when to use them, refer to RFM Selection Criteria List of Values.
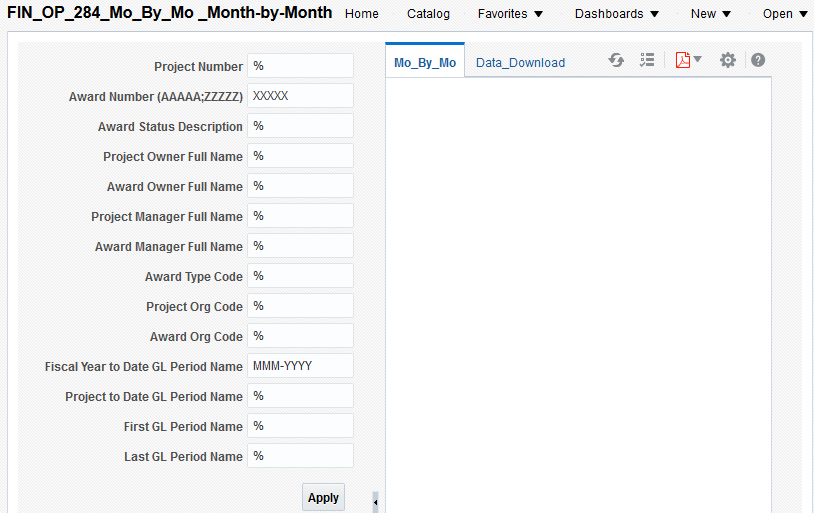
Report Views
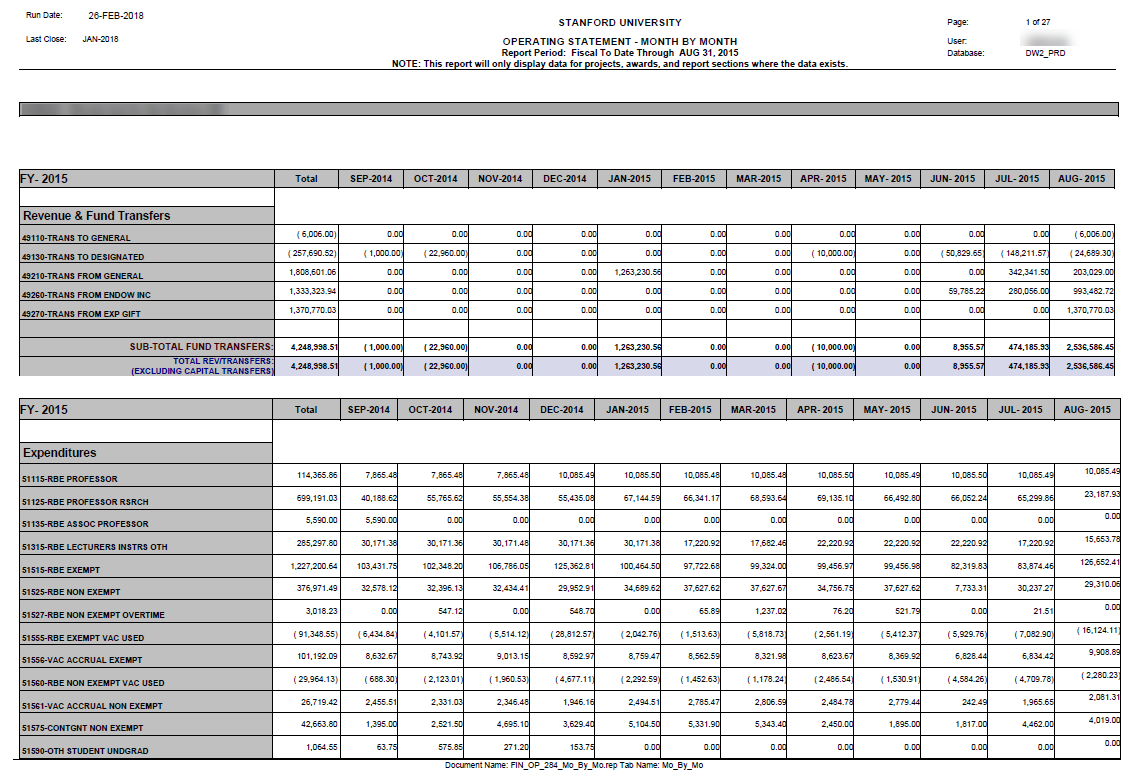
The data download has 36 columns of data organized into sections for revenue, fund transfers, expenditures, gain/loss and capital transfers.
Understanding the Data
For additional information, refer to RFM Resources in System: OBI Financial Reporting.
Operating Statement Year by Year
Non-customizable, BI Publisher report, Operating Statement Year by Year report provides yearly operating statement summary information by award and object code, sectioned by revenue, fund transfers, expenditures, gain/loss and capital transfers. The yearly information also provides summary information on other Assets and Liabilities codes. (formerly FIN_OP_284_Mo_By_Mo_Year-By-Year).
Sample Business Questions
- What is my revenue and expense year by year by object code?
- What are my gains/losses month by month?
- What is my summary information about assets and liabilities?
Selection Criteria
- The Selection Criteria section is located on the left hand side of the screen.
- For additional information, refer to BI Publisher Reports.
- For a list of the RFM common selection criteria, their associated list of values and when to use them, refer to RFM Selection Criteria List of Values.
- A GL Period perspective must be entered. Choose either Fiscal Year to Date, Project to Date or both a First GL Period and a Last GL Period.
Report Views
For examples of the reports available, view the screenshots below:
The data download has 36 columns of data organized into sections for Revenue, Fund Transfers, Expenditures, Gain/Loss and Capital Transfers.
Understanding the Data
For additional information refer to RFM Resources in System: OBI Financial Reporting.
Fund Variance
The Fund Variance report shows the variance between two fund statements of differing reporting periods to show their values and differences (similar to RM3 238 report).
Sample Business Questions
- How do the fund statements compare this year vs. last year of given awards?
- Which awards have the largest percentage difference this year vs. last for receipts and expenses?
- How large is the dollar difference of expenses between projects this summer vs. last summer?
Selection Criteria
- To retrieve results, be sure to follow the Selection Criteria instructions near the top of the screen. Refer to Using Selection Criteria for OBI Reports for more guidance.
- For a list of the RFM common selection criteria, their associated list of values and when to use them, refer to RFM Selection Criteria List of Values.
Report Views
For examples of the reports available, view the screenshots below:
There is an equivalent report section for EN Set of Books just not displayed here.
Understanding the Data
Note that EN set of books only exists for endowments while SU set of books exists for all funds. SU is the expendable or income value while EN is the endowment or book value. For additional information about endowments and the difference between SU and EN set of books, refer to Topic Overview: Endowments.
Additional Resources
- For a list of fields available to include in report customizations, refer to Data Fields Available in RFM Dashboard.
- To understand how object codes roll up into higher level groupings, refer to RFM Object Code Rollups.
Projected Budget Variance
The Projected Budget Variance Report shows the projected difference between budget and actual, while incorporating commitments and anticipated remaining endowment payout. It includes all budget types: beginning balance, receipts, transfers, and expenses, at a variety of detail levels including both Tidemark and OBI rollups.
This report uses the Fund and Expenditure Management (FEM) subject area, and where available, report drills to Consolidated Expenditure Reporting (CER) and Revenue and Fund Management (RFM) reports to provide more detailed information.
Sample Business Questions
- What is my comprehensive budget picture in OBI expenditure type and object code high level groupings?
- What is my projected budget variance taking into account actuals, commitments, and endowment payouts?
- What is the difference between the budget picture seen from the perspective of Consolidated Budget chart of accounts vs OBI groupings?
- What are the month-by-month details of actual performance vs annual budget?
- What is my variance between year-to-date actuals and year-to-date budget?
Selection Criteria
To retrieve results, be sure to follow the Selection Criteria instructions near the top of the screen. Refer to Using Selection Criteria for OBI Reports for more guidance.
Budget Sources
- Budget Management Tool refers to Tidemark and Hyperion.
- iBudgets refers to mid-year adjustments created in the iBudgets system.
- Grants Accounting refers to sponsored project budgets and capital project budgets.
GL Periods
- Expenditure commitments data is only returned if the ending GL Period requested is the Last Closed or Current open period.
- If using a first and last date range, be aware that fiscal year beginning balances and annual budget amounts are stored in the September GL Period.
For a list of the RFM common selection criteria, their associated list of values and when to use them, refer to RFM Selection Criteria List of Values.
Report Views
The first three views include Award Number and Budget Amount, Fiscal Year Beginning Balance Amount, Funds and Expenditures Actual Amount, Expenditure Commitment Amount, MP Anticipated Remaining Payout Amount, and Projected Budget Variance Amount. To view more details, drills are available on budget amounts, funds and expenditures amounts, and expenditure commitment amounts.
By award and expenditure type/object code high level group description, compares the fiscal year budget amount to the sum of actuals, expenditure commitments and anticipated payout to determine the projected budget variance amount.
By award and expenditure type/object code high level group description, compares the fiscal year budget amount to the sum of actuals (displayed by GL period), expenditure commitments and anticipated payout to determine the projected budget variance amount. (Due to the way this report is constructed, it requires more processing time before results are displayed.)
By award and Consolidated Budget CoA level 4, compares the fiscal year budget amount to the sum of actuals (displayed by GL period), expenditure commitments and anticipated payout to determine the projected budget variance amount. (Due to the way this report is constructed, it requires more processing time before results are displayed.)
By award and expenditure type/object code high level group description, compares the fiscal year-to-date budget incremental amount to the sum of actuals to determine the budget incremental variance amount.
At the bottom of the report, are links to the Budget Variance and Budget Variance Data Download that when selected will run using the same selection criteria entered in the Projected Budget Variance Report.
Understanding the Data
Projected Budget Variance Amount
Projected Budget Variance Amount is derived using the following formula: -(Budget Amount - Fiscal Year Beginning Balance Amount - Funds and Expenditures Actual Amount - Expenditure Commitment Amount - MP Anticipated Remaining Payout Amount)
MP Anticipated Remaining Payout Amount
MP Anticipated Remaining Payout Amount is a calculation equal to the latest monthly payout multiplied by the number of remaining months in the fiscal year. This amount will be incorrect if there are manual adjustments to payout in the latest month or new gifts to endowment principal in future months.
Consolidated Award and Task Org
Use Consolidated Award and Task Org field, as an include column, to illustrate when one org is spending the funds owned by another org. The Consolidated Award and Task Org field has the following logic:
- If Natural Account Key begins with 1, 2, 3, 4, or APPOUT, then show Award Org Hierarchy.
- If Natural Account Key begins with 5, or APPIN then show Task Org Hierarchy.
Additional Resources
- For a list of fields available to include in report customizations, refer to Data Fields Available in RFM Dashboard.
- To understand how object codes roll up into higher level groupings, refer to RFM Object Code Rollups.
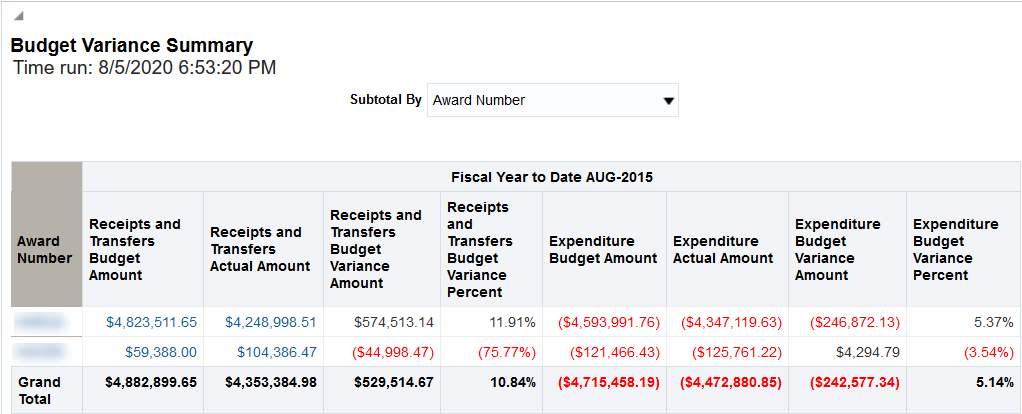
Budget Variance
The Budget Variance Report shows Variance of budget vs. actual in fund statement format showing values and differences for the reporting period (similar to RM3 165 and 166 reports).
Sample Business Questions
- How did the net revenues, transfers and expenses on my award(s) vary from budget over the period between X and Y or P/FTD?
- What did I budget for transfers over the period between X and Y or P/FTD?
- What are the components affecting large variances from budget?
Selection Criteria
- To retrieve results, be sure to follow the Selection Criteria instructions near the top of the screen. Refer to Using Selection Criteria for OBI Reports for more guidance.
- For a list of the RFM common selection criteria, their associated list of values and when to use them, refer to RFM Selection Criteria List of Values. [dummy#1349]
- If a range of GL periods is specified rather than using Fiscal to Date or Project to Date then the third set of budget/variance amounts in the expanded view will be misleading (refer to Understanding the Date section below) as the full year budget is posted to the SEP GL Period each year. If SEP is not included then neither will the annual budget amounts.
Report Views
For examples of the reports available, view the screenshots below:
Understanding the Data
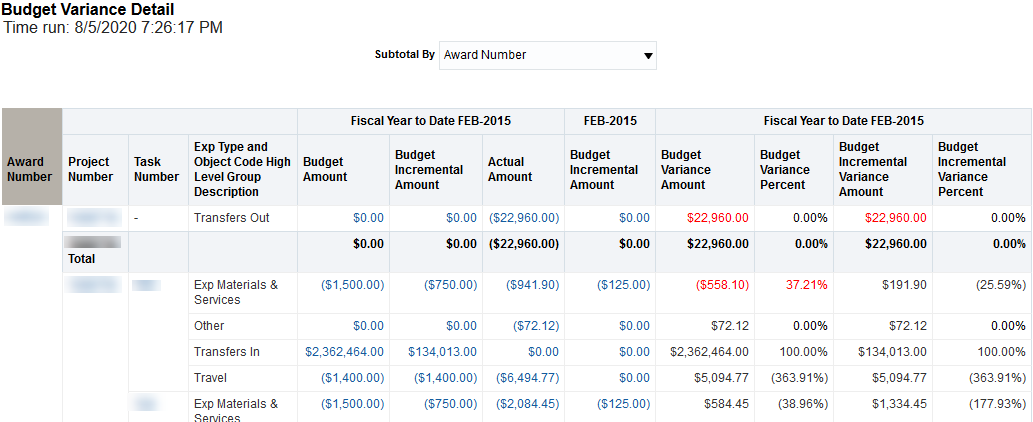
The expanded views show three time periods
- Fiscal year to date has the incremental budget, i.e., the portion of the annual budget applicable up to that point in time added up month by month (after 6 months about half) and the variance is comparing months of budget to months of actual activity. The variance is likely to be very small if the year is proceeding close to the anticipated budget.
- The last (most recent) request listed as a single GL Period compared to the budget for that single GL Period.
- The full fiscal year budget compared to the actual activity up the requested GL Period. A report run mid fiscal year would likely show activity that is only half of the annual budget and the variance would then be equal to the remaining half of the budget, i.e., half left to go.
Additional Resources
- For a list of fields available to include in report customizations, refer to Data Fields Available in RFM Dashboard.
- To understand how object codes roll up into higher level groupings, refer to RFM Object Code Rollups.
Budget Transactions Details
The Budget Transactions Details Report shows details for Budget Tool (9/1 non-sponsored operating budget), iBudgets (mid year changes to operating budget) and GA Budget (sponsored activity budget) (similar to RM3 165 and 166 reports).
Sample Business Questions
- What iBudgets activity comprises the budget numbers for my award(s) over the period between X and Y, or P/F.TD?
- Who prepared the iBudgets entry that was posted against my award(s)?
Selection Criteria
- To retrieve results, be sure to follow the Selection Criteria instructions near the top of the screen. Refer to Using Selection Criteria for OBI Reports for more guidance.
- For a list of the RFM common selection criteria, their associated list of values and when to use them, refer to RFM Selection Criteria List of Values.
- The annual budget, also called 9/1 budget, is stored in the SEP GL Period. If the selection criteria specify a first and last GL Period that does not include SEP then the 9/1 budget will not appear in the report.
Report Views
For examples of the reports available, view the screenshots below:
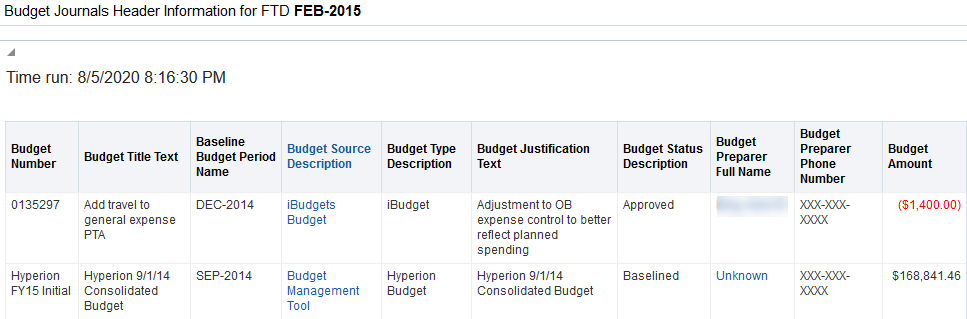
Budget Type Description lists the system used for entry, either iBudgets for mid-year adjustments or the annual budget tool, currently Tidemark but for FY16 and earlier Hyperion Budget.
Understanding the Data
For additional information about iBudgets, refer to System: iBudgets.
Additional Resources
- For a list of fields available to include in report customizations, refer to Data Fields Available in RFM Dashboard.
- To understand how object codes roll up into higher level groupings, refer to RFM Object Code Rollups.
Endowment and Donor
The Endowment and Donor Report shows endowment related data such as investment pools, share quantities, share values, book values and market values. Donor Financial Report with gifts and endowment related data shown in the donor reporting format (similar to RM3 123 and 128 reports).
Demo of Endowment and Donor report within the RMF Dashboard in OBI
Sample Business Questions
- How many shares do my endowment awards have by pool and share type (pure vs quasi) and what is the market share value?
- What is the book and market value of my endowment awards?
- What has been the trend of market value over time?
- What is the value of my "Specific Investments" now and over time?
- What is the high level overview of my endowments for the Donor Endowment Financial Report?
Selection Criteria
- To retrieve results, be sure to follow the Selection Criteria instructions near the top of the screen. Refer to Using Selection Criteria for OBI Reports for more guidance.
- For a list of the RFM common selection criteria, their associated list of values and when to use them, refer to RFM Selection Criteria List of Values.
Report Views
For definitions of the terms used in the reports, refer to Glossary of Endowment - Related Terms.
All values are for the Endowment (EN) Journal Ledger code (aka set of books).
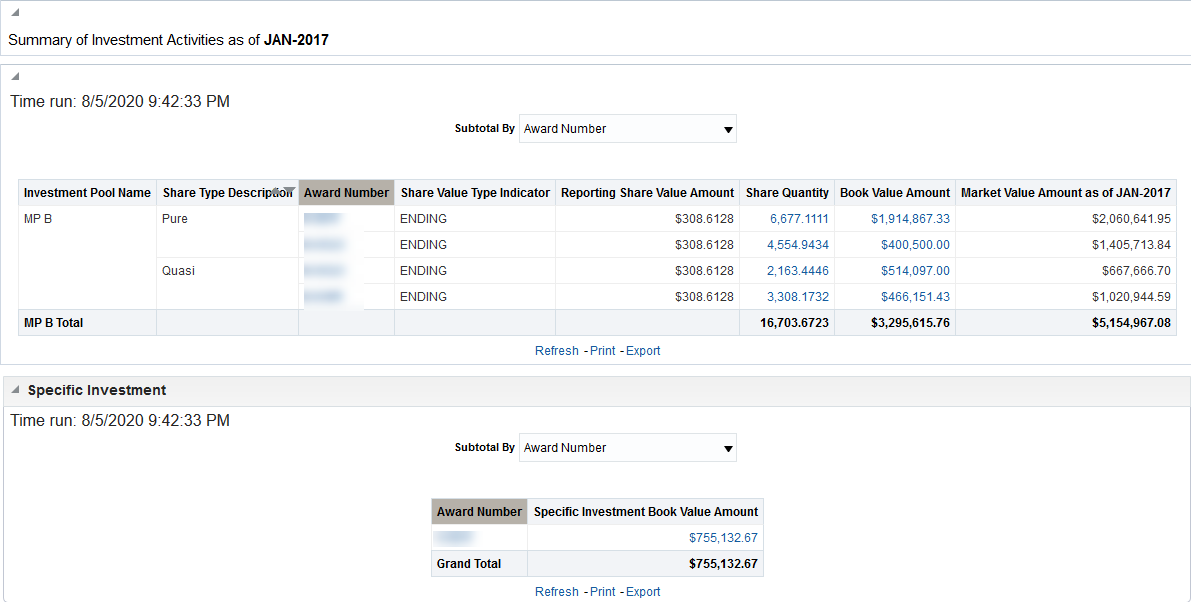
Displays the market and book value of the investments in the designated merged pools for the last GL period.
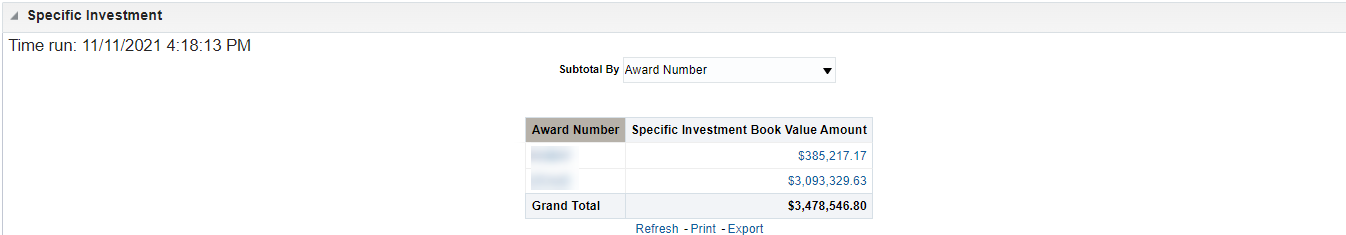
Displays value of donations outside of the merged pool and not eligible for regular endowment appreciation of value.
Displays by GL period how the market and book value has changed over the selected time range.
If Specific Investment displays above, then another report called Specific Investment will display the same funds showing how the book value changed by GL period over the selected time range.
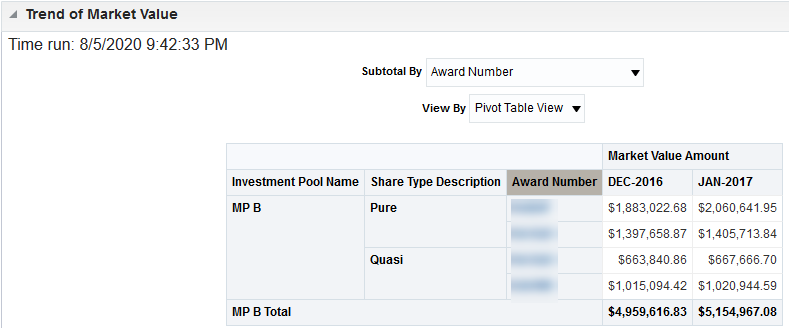
Displays market value by period in columns to see how market value has changed over time. Selected time periods can be GL period, Fiscal Quarter, Fiscal Year, Calendar Quarter or Calendar Year.
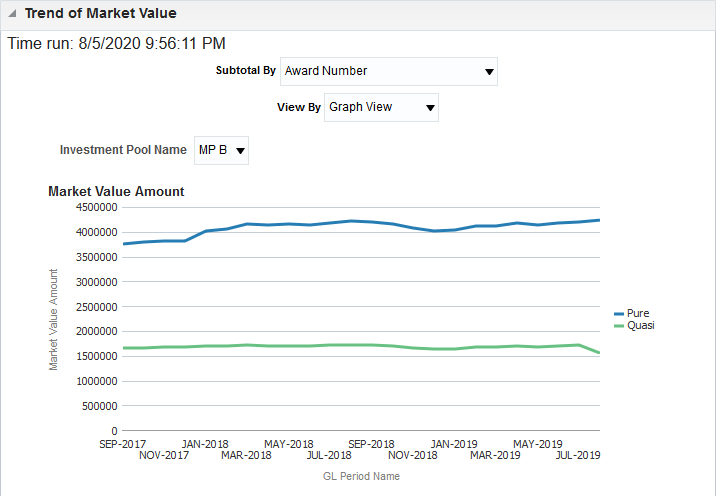
Displays the market value by period in a graphical format. Selected time periods can be GL period, Fiscal Quarter, Fiscal Year, Calendar Quarter or Calendar Year.
Displays a high level summary of all activity for the selected time period. Besides market gains and losses, it includes new gifts, transfers and adjustments,and payout activity.
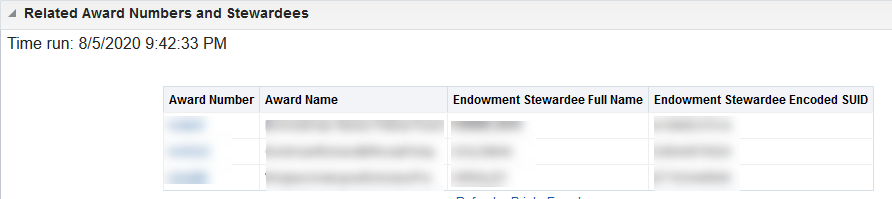
Displays the name of the award with the name and ID of the stewardee.
Understanding the Data
- Specific Investments shows the value of endowments which are temporarily held in investments outside the merged pool and are not eligible for regular endowment appreciation of value. Eventually they will be liquidated and the proceeds used to buy shares like a regular endowment.
- For more information about endowments refer to Topic Overview: Endowments Payout Process.
Additional Resources
- For a list of fields available to include in report customizations, refer to Data Fields Available in RFM Dashboard.
- To understand how object codes roll up into higher level groupings, refer to RFM Object Code Rollups.
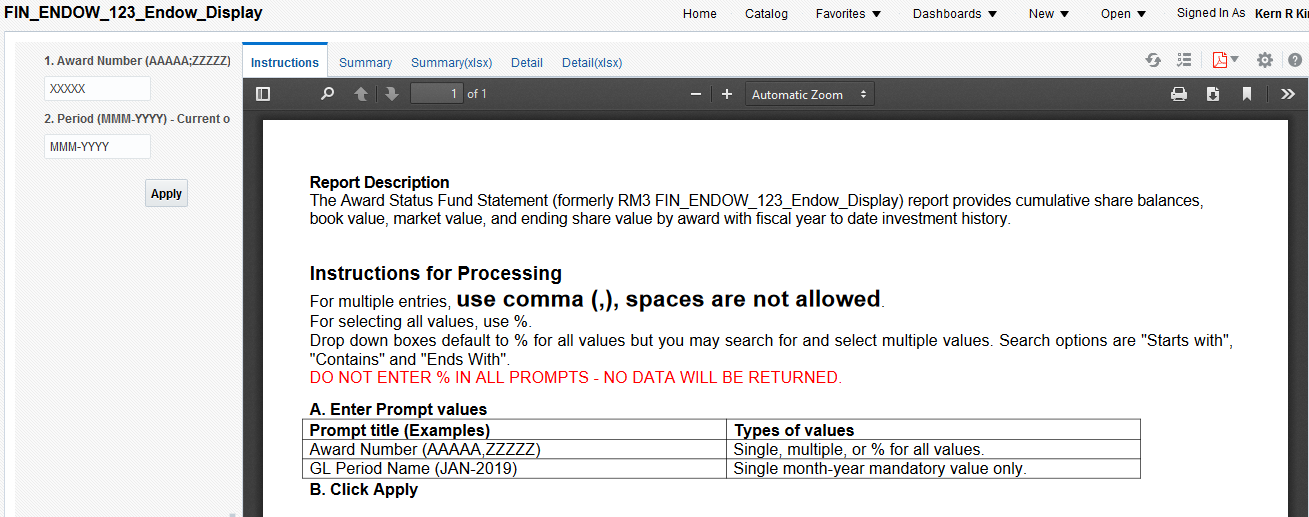
Endowment Award Summary and FTD Investment History
Non-customizable, BI Publisher report, Endowment Award Summary including cumulative share balances, book value, market value and ending share value by award with fiscal year to date investment history (formerly the RM3 FIN_ENDOW_123_Endow_Display).
Launch OBI Endowment Award Summary and FTD Investment History
Sample Business Questions
What are the fiscal YTD details of my endowments?
Selection Criteria
- The Selection Criteria section is located on the left hand side of the screen. Instructions are on the first tab.
- For additional information, refer to BI Publisher Reports.
- For a list of the RFM common selection criteria, their associated list of values and when to use them, refer to RFM Selection Criteria List of Values.
Report Views
For examples of the reports available, view the screenshots below:
There are also Excel data download versions of these two reports.
Understanding the Data
For additional information, refer to RFM Resources in System: OBI Financial Reporting.
Endowment Investment Summary by Pool
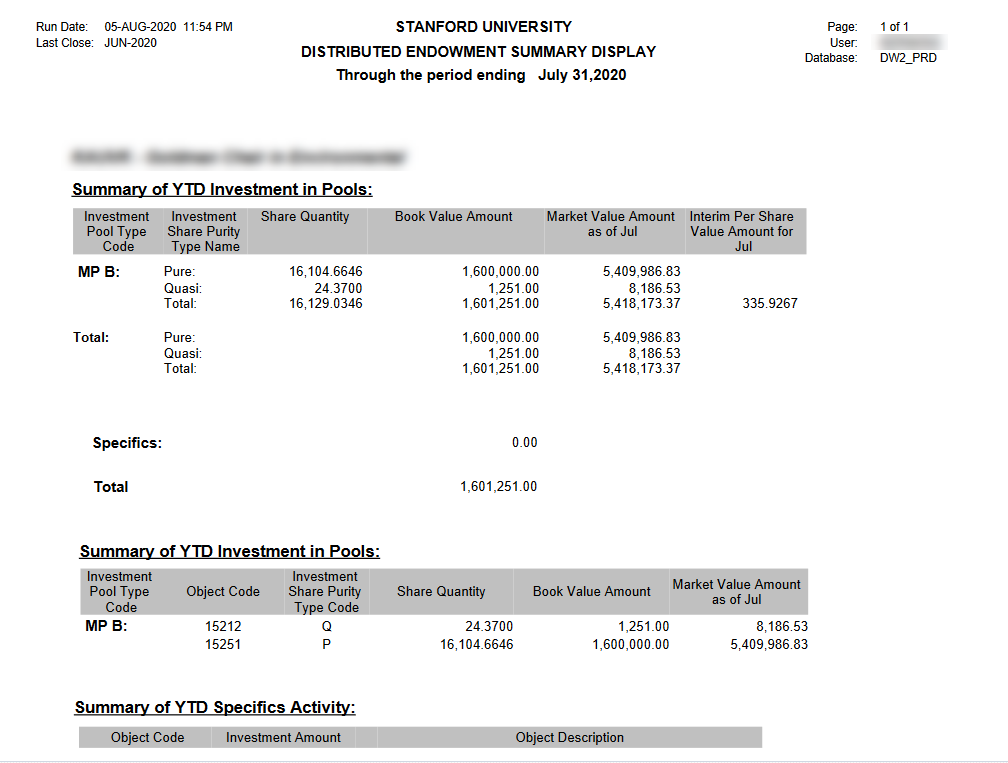
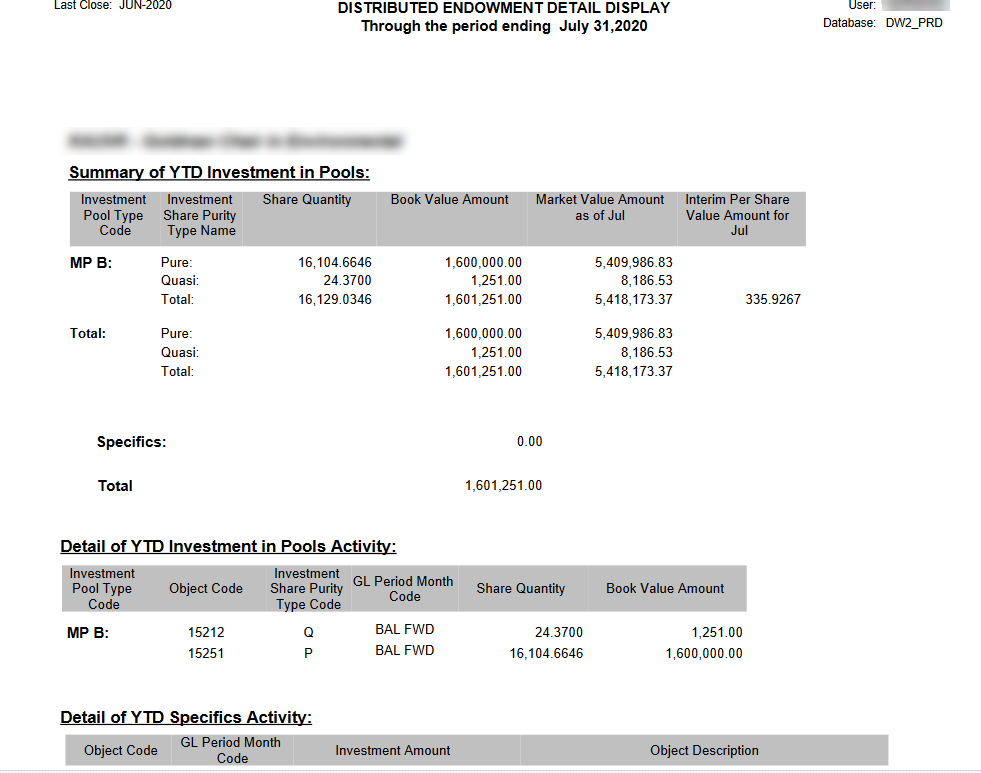
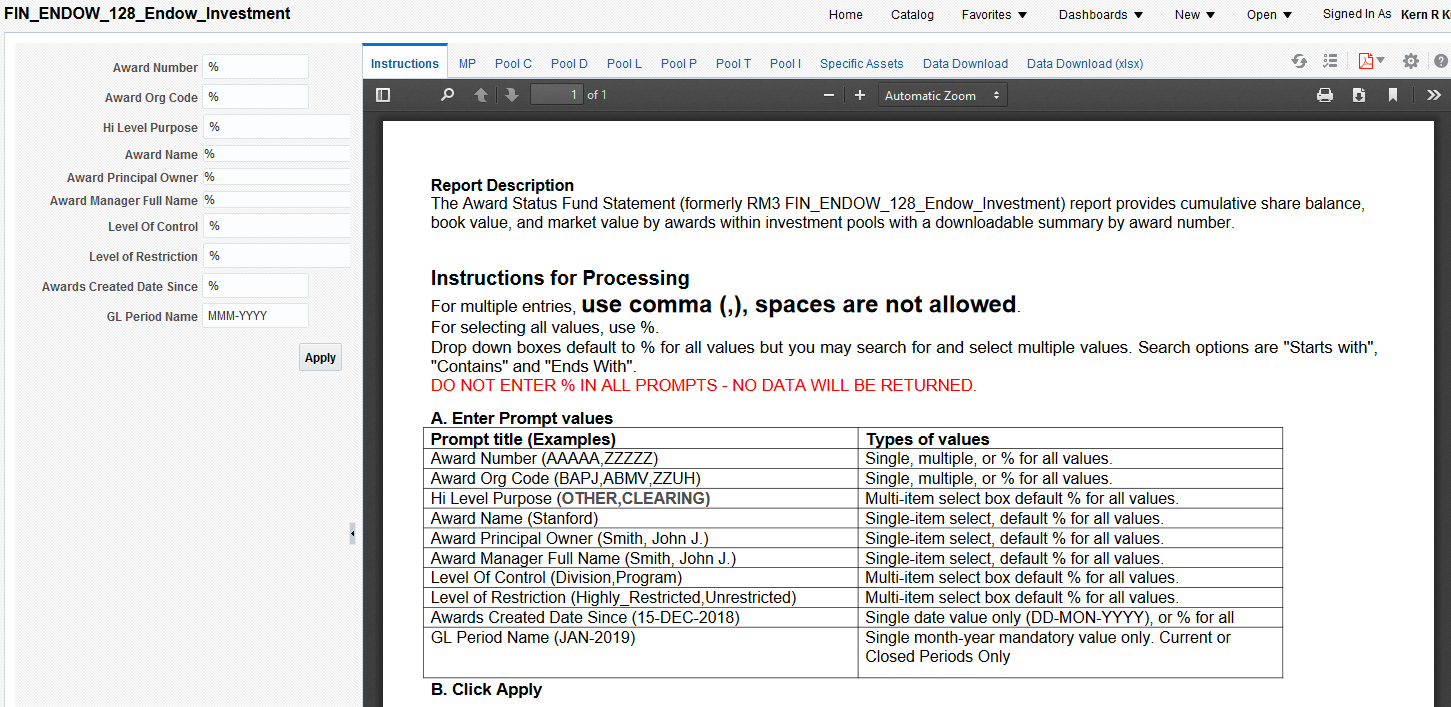
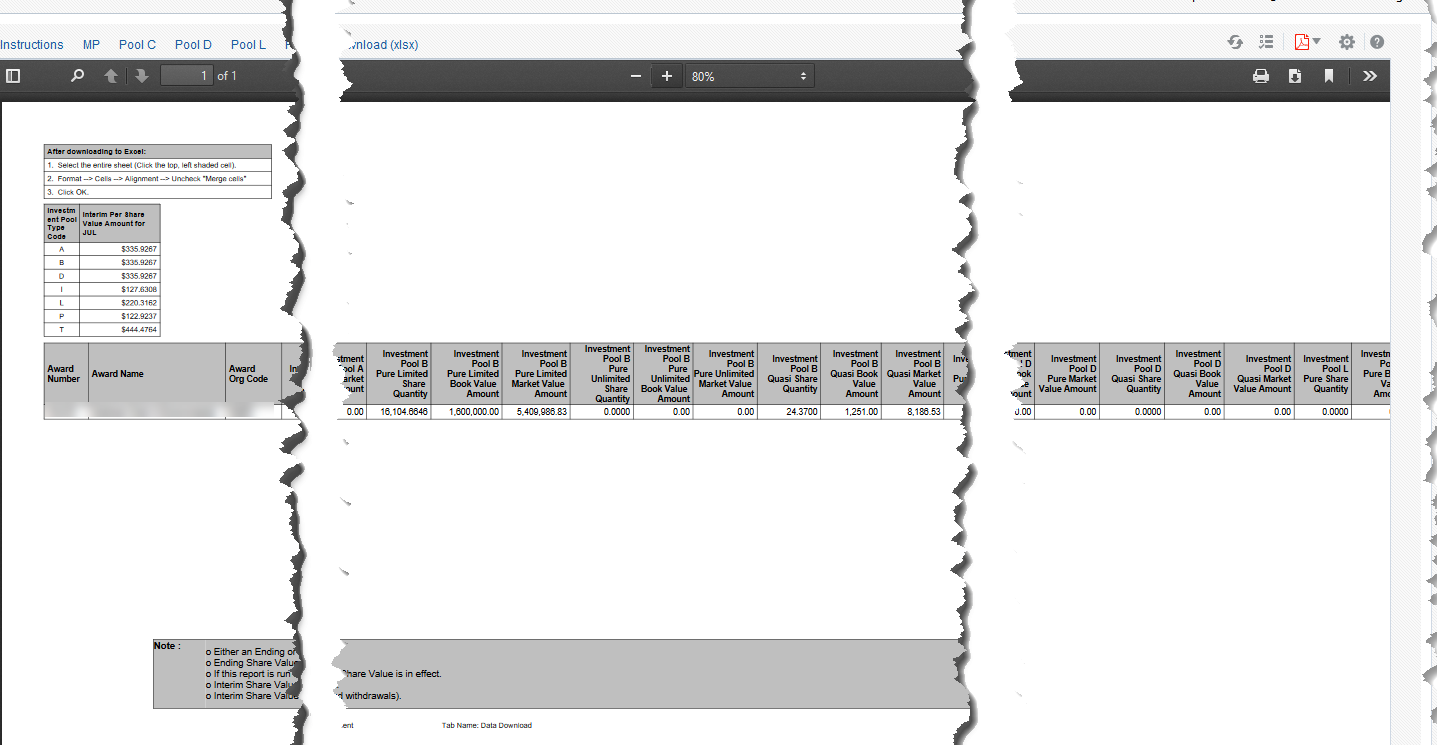
Non-customizable, BI Publisher report, Endowment Summary including cumulative share balance, book value and market value by awards within investment pools with a downloadable summary by award number (formerly the RM3 FIN_ENDOW_128_Endow_Investment).
Sample Business Questions
- What are the share values of all the investment pools by pool type code for any GL Period?
- For each award, how many shares does it have and in which pools are they invested?
Selection Criteria
- The Selection Criteria section is located on the left hand side of the screen. Instructions are on the first tab.
- For additional information, refer to BI Publisher Reports.
- For a list of the RFM common selection criteria, their associated list of values and when to use them, refer to RFM Selection Criteria List of Values.
Report Views
For examples of the reports available, view the screenshots below:
The download lists all pool share values but only the share quantity and market values of the returned awards. There are also individual reports by pool not shown here.
Understanding the Data
For additional information, refer to RFM Resources in System: OBI Financial Reporting.
Pledge Report
The Pledge Report shows pledges and pledge schedules for given awards.
Sample Business Questions
- What pledges have been made to my award(s)?
- What is the scheduled receipt of pledges made to my award(s)?
- What is the pledge paid amount for my award(s)?
Selection Criteria
- To retrieve results, be sure to follow the Selection Criteria instructions near the top of the screen. Refer to Using Selection Criteria for OBI Reports for more guidance.
- For a list of the RFM common selection criteria, their associated list of values and when to use them, refer to RFM Selection Criteria List of Values.
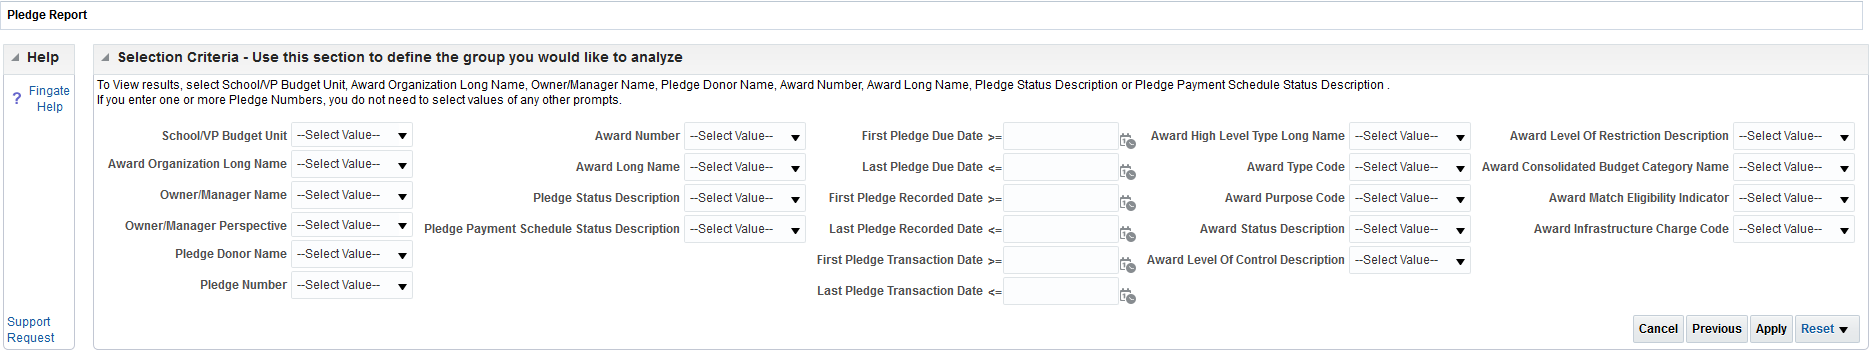
Entering a date range is not necessary for the Pledge report.
Report Views
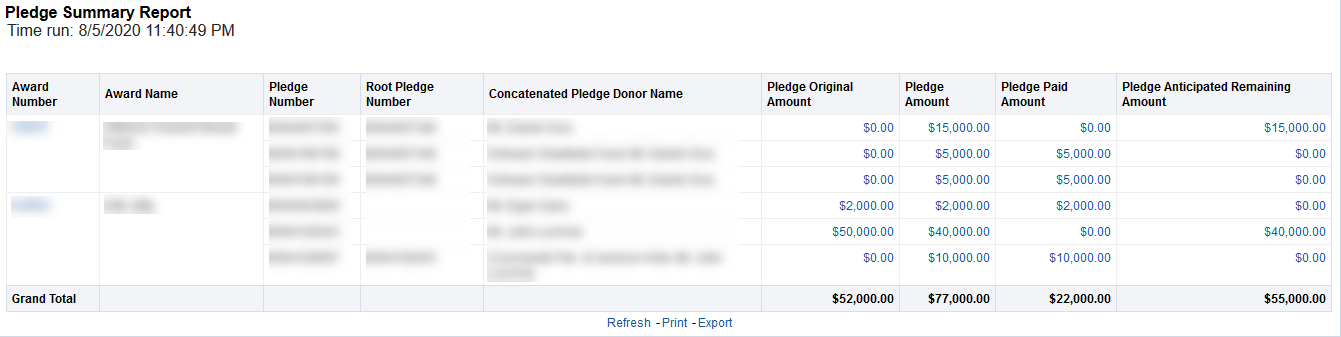
Displays by award the total of pledges made, paid and remaining pledges due.
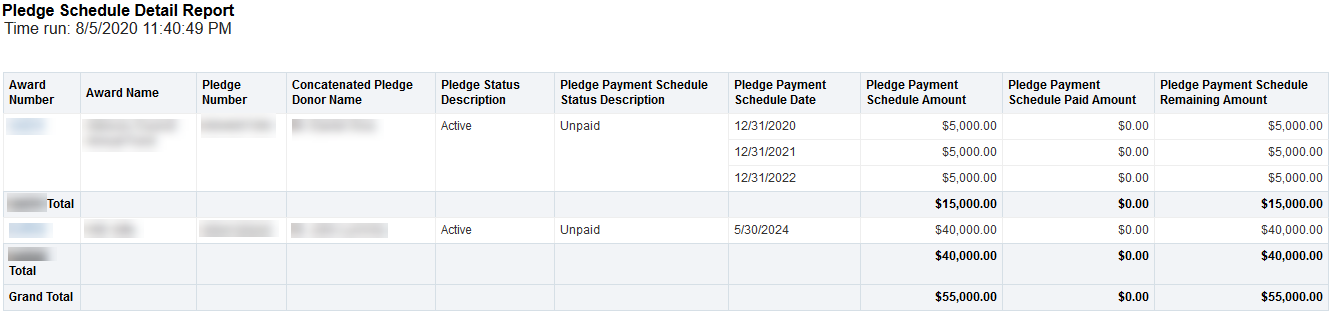
Displays by award the scheduled pledge payment dates, which installments have been paid and the balance of any outstanding pledges.
Understanding the Data
- For a list of fields available to include in report customizations, refer to Data Fields Available in RFM Dashboard.
- To understand how object codes roll up into higher level groupings, refer to RFM Object Code Rollups.
Unused and Underwater Endowment Funds Dashboard
The Unused and Underwater Endowment Funds Dashboard shows awards that are unused and/or underwater (market value is less than book value).
Sample Business Questions
- Which of my endowment funds are underwater?
- Which of my endowment funds are underutilized; i.e., are building up large balances compared to annual payout?
- What are my endowment payout amounts and anticipated payout amounts?
- Which of my endowments no longer have any payouts?
- What is the ending book value and ending market value of my endowment?
Selection Criteria
To retrieve results, be sure to follow the Selection Criteria instructions near the top of the screen. Refer to Using Selection Criteria for OBI Reports for more guidance.
For a list of the RFM common selection criteria, their associated list of values and when to use them, refer to RFM Selection Criteria List of Values.
Report Views
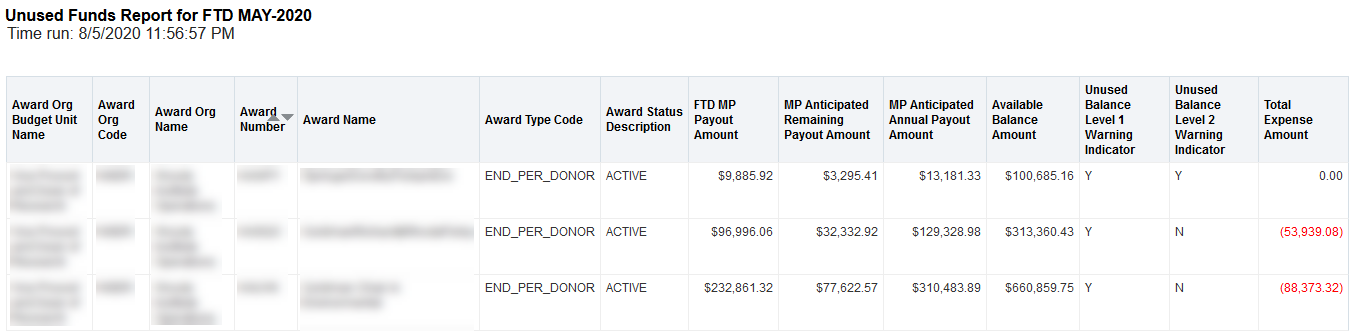
Unused Funds Report
Unused funds are endowments where the accrued available balance from payout exceeds certain multiples of annual payout. Unused Balance Level 1 Warning Indicator = Y means more than two times annual payout and Unused Balance Level 2 Warning Indicator = Y means more than four times annual payout.
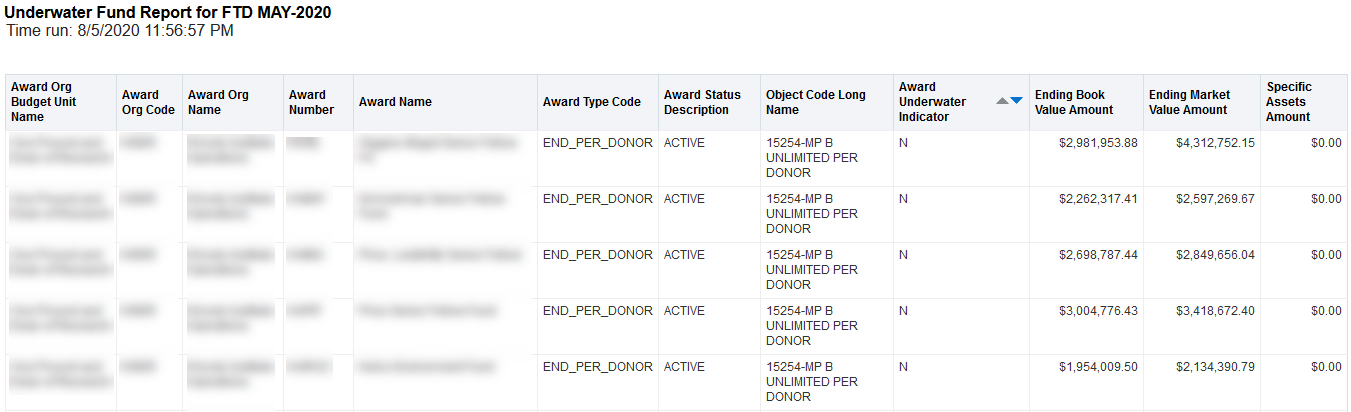
Underwater Fund Report
Underwater funds are those endowments where the market value is less than the book value. Underwater funds are designated by Award Underwater Indicator =Y.
Understanding the Data
For additional information, refer to RFM Resources in System: OBI Financial Reporting.
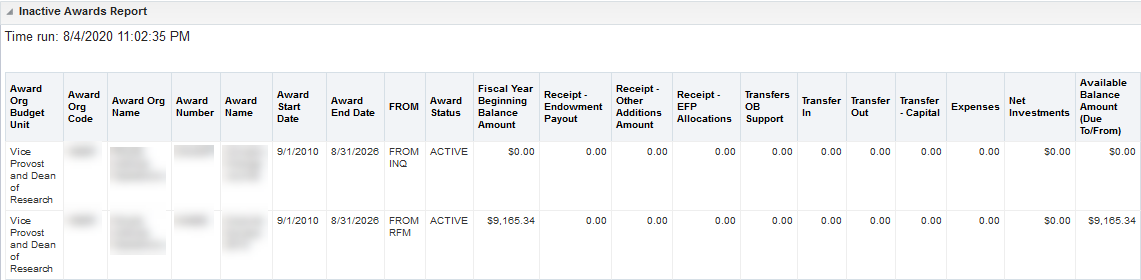
Inactive Awards Report
The Inactive Awards Report shows awards which have no activity fiscal year to date; i.e., no money coming in or going out. If they have no balance and no future planned activity then they should be closed. If they have a balance and no planned use for the funds, it is advisable to find a way to spend the funds or give them back to the donor in the case of a gift.
Sample Business Questions
- Which of my awards had no activity this fiscal year to date but have a balance so I should consider spending?
- Which of my awards had no activity this fiscal year to date and have no balance so I should consider closing?
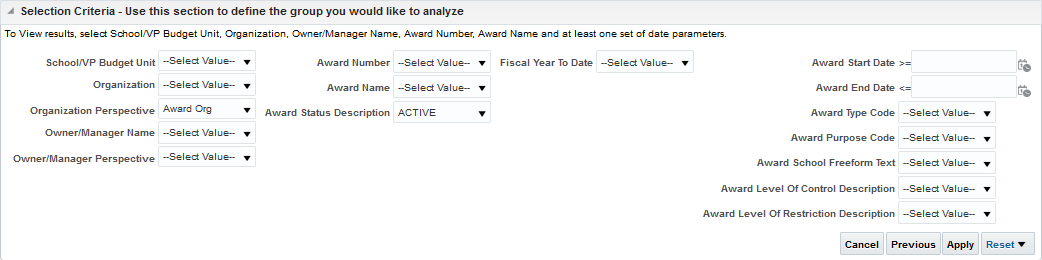
Selection Criteria
- To retrieve results, be sure to follow the Selection Criteria instructions near the top of the screen. Refer to Using Selection Criteria for OBI Reports for more guidance.
- For a list of the RFM common selection criteria, their associated list of values and when to use them, refer to RFM Selection Criteria List of Values.
- Select the Current Open GL Period or earlier. Future GL Periods do not return an available balance.
Report Views
For an examples of the report available, view the screenshot below:
Understanding the Data
All awards with no activity appear in this report whether they have a balance or not. If they have a balance they will also appear in the Fund Statement report. Some awards have zero net activity due to offsetting transactions (e.g. an erroneous transfer in that is reversed) and because of that activity those will not appear in this report but will appear in the Fund Statement.
Awards with zero balance and no future planned activity should be closed, refer to Topic Overview: Life Cycle of a Fund/Closing the Fund.For additional information, refer to RFM Resources in System: OBI Financial Reporting.