Expense Requests Efficacy Dashboard
The OBI Expense Request Efficacy (ERE) Dashboard provides business unit managers reports to effectively monitor the accuracy rate and cycle time of their units' expense request processing. The dashboard offers the following information in tabular and graphical formats.
- Summarized approval/rejection counts and rates by organization and where in the approval process it was rejected (local approval or audit).
- Reasons for rejection are displayed by frequency for an organization and can be displayed by preparer, payee or approver to facilitate targeted training.
- Metrics for expense request processing time by organization is displayed for average submission, approval and total processing times. Some reports include trend line charts for better visualization of performance over time.
- Ability to view paid expense request transactions by dollar amount range.
- Escalated expense request count for your organization by approval status.
The displayed numbers can be drilled on to examine the details of the expense requests that make up the counts.
These reports can help identify trends and issues, leading to opportunities for:
- Training –Identify opportunities for training within your team that can help with less rejection/return rates and escalations.
- Policy Discussions – identify behavior trends that can lead to discussions about policy clarifications or change recommendations to central offices.
- Resource Allocation – View workload and transactions by preparer/approver to make any adjustments to team responsibilities as needed.
The Expense Request Efficacy (ERE) Dashboard is not listed independently in the OBI Dashboards menu and is instead accessed as a link from the OBI Expense Request (ERR) Dashboard home page.
Launch OBI Expense Request Efficacy Dashboard
| Select this link... | ...for reports about | |
|---|---|---|
| ER Rejection Stats | Shows data on paid transactions that had been rejected or returned prior to final approval. Displays views of rejected/returned expense requests by preparer, approver, auditor organization and reason. | |
| ER Rejection Detail by Employee | Shows expense request approval and rejection/return count by preparer, approver and supplier/payee. Displays percentage of expense request transactions that were rejected/returned. | |
| ER Processing Stats | Shows expense request transaction counts and displays the average processing times for submissions and approvals. Graphically displays how these averages trend over time. | |
| Expense Requests in Range | Shows expense requests between a dollar amount range for specific searches of a transaction(s). | |
| ER Detail by Employee | Shows spending of approved and rejected/returned transactions data by supplier/payee, preparer and approver. | |
| ER Escalation | Shows data on escalation transaction frequency. |
Expense Request (ER) Rejection Statistics
Displays rejection rates of expense requests by organization, preparer, type of approver (local or auditor) and the reject/return reasons. Results can suggest areas needing increased training to reduce rejection/return rates.
Sample Business Questions
- What is the number of expense requests that have been rejected/returned prior to final approval? How many are rejected/returned by a departmental approver and how many by an auditor?
- To support training of our staff, what are the most common reasons for rejection/returns?
- What is the high level assessment of our expense request processing throughput and the amount of expense request resubmissions?
Selection Criteria
For best results, be sure to follow the Selection Criteria instructions near the top of the screen. Refer to Using Selection Criteria for OBI Reports for more guidance.
Report Views
The ER Rejection Statistics has five sections that displays different perspectives on expense request rejections/returns that have already posted. Refer to the following screenshots.
In the reports and graphics, rejection counts include both rejections and expense request returns to the preparer.
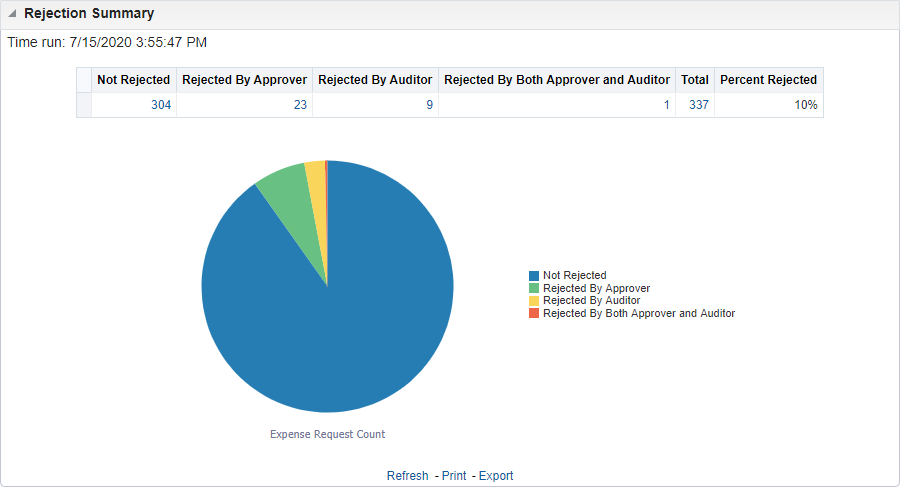
Rejection Summary
Displays rejection summary by who rejected: approver, auditor or both. If the expense request was rejected by both approver and auditor, it would not be double counted in the other categories.
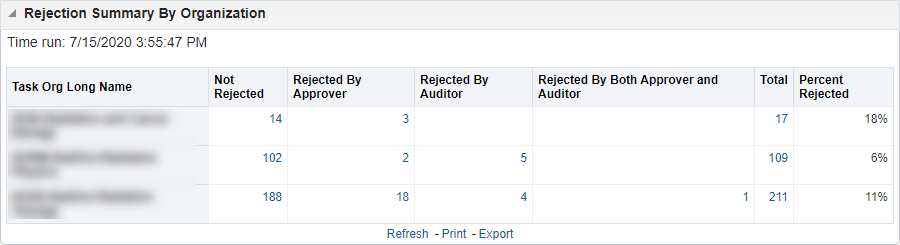
Rejection Summary by Organization
Displays rejection summary by organization. Shows who rejected: approver, auditor or both. If the expense request was rejected by both approver and auditor, it would not be double counted in the other categories.
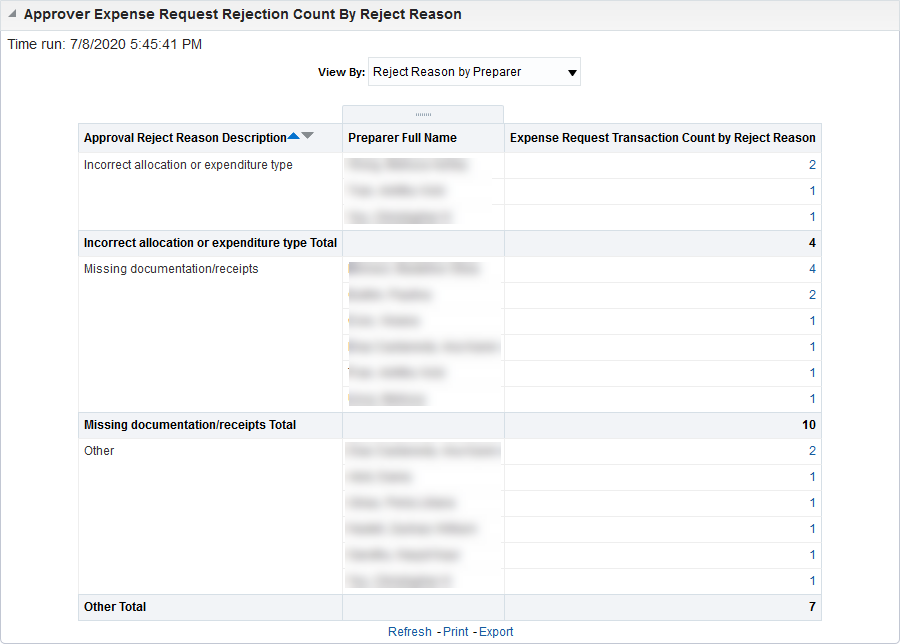
Approver Expense Request Rejection Count By Reject Reason
Displays, in two different views, the reasons for expense request rejections by the approver.
The Approver Expense Request Rejection Counts by Reject Reason may not match the Rejected by Approver counts because the approver may have selected more than one reject reason or may have chosen no reject reason.
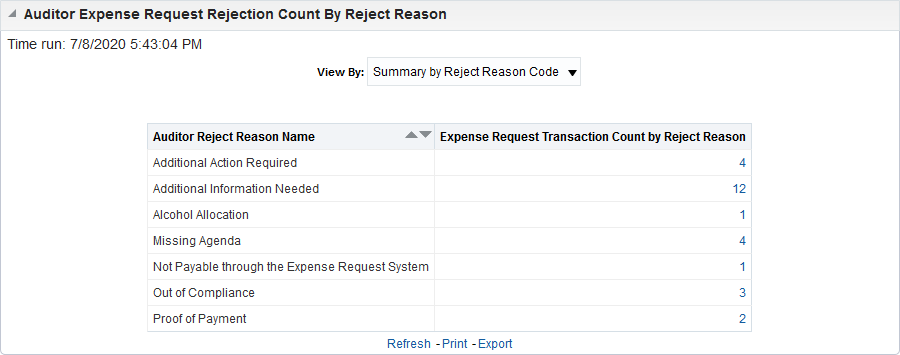
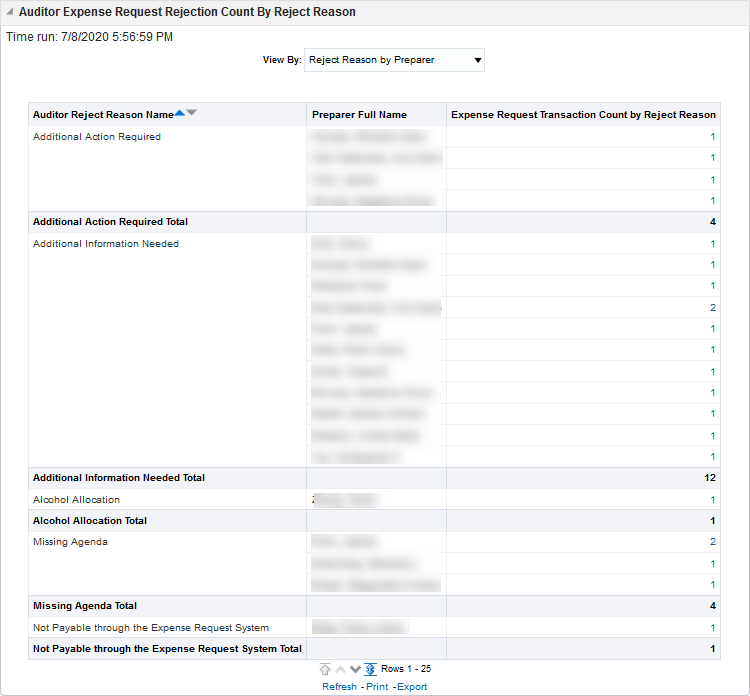
Auditor Expense Request Rejection Count by Reject Reason
Displays, in two different views, the reasons for expense request rejections by the auditor.
The Auditor Expense Request Rejection Counts by Reject Reason may not match the Rejected by Auditor counts because the auditor may have selected more than one reject reason or may have chosen no reject reason.
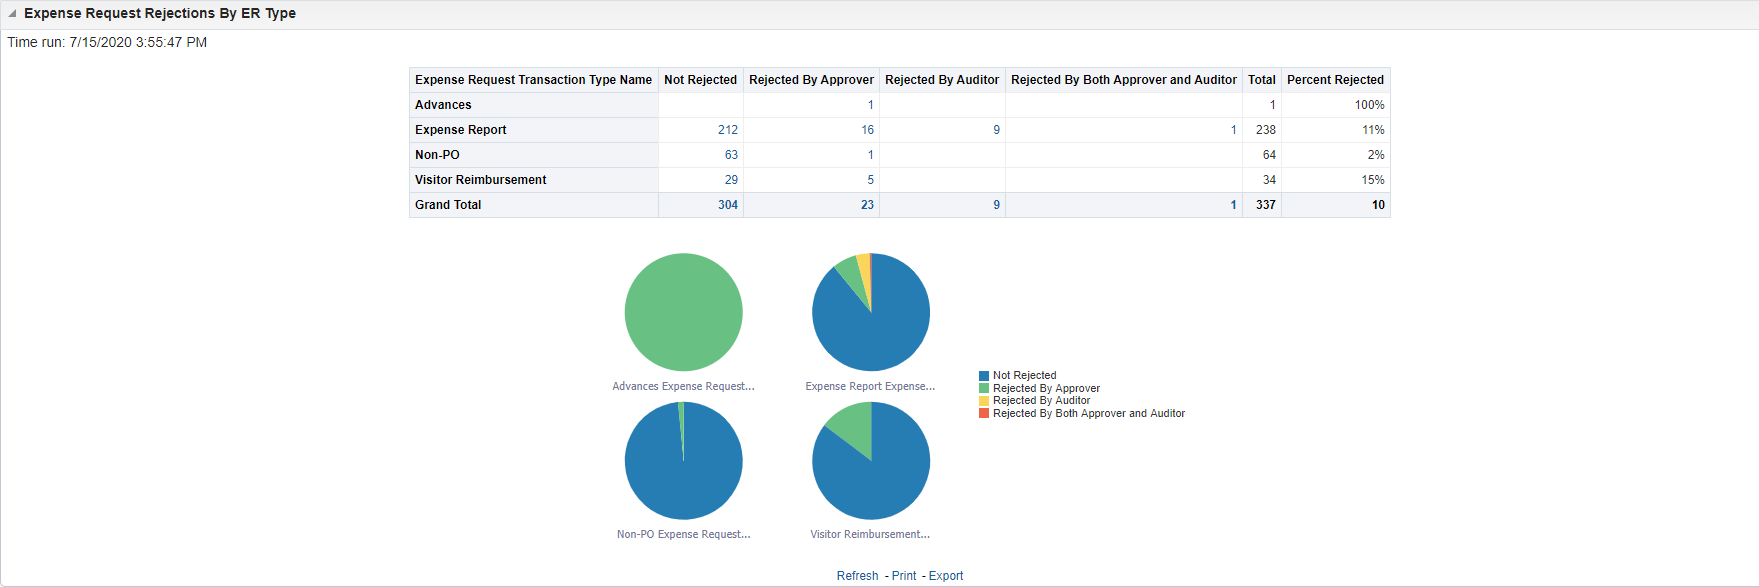
Expense Request Rejections by ER Type
Displays rejection counts by expense request type (expense report, visitor reimbursement, advances, non-PO payments, and petty cash).
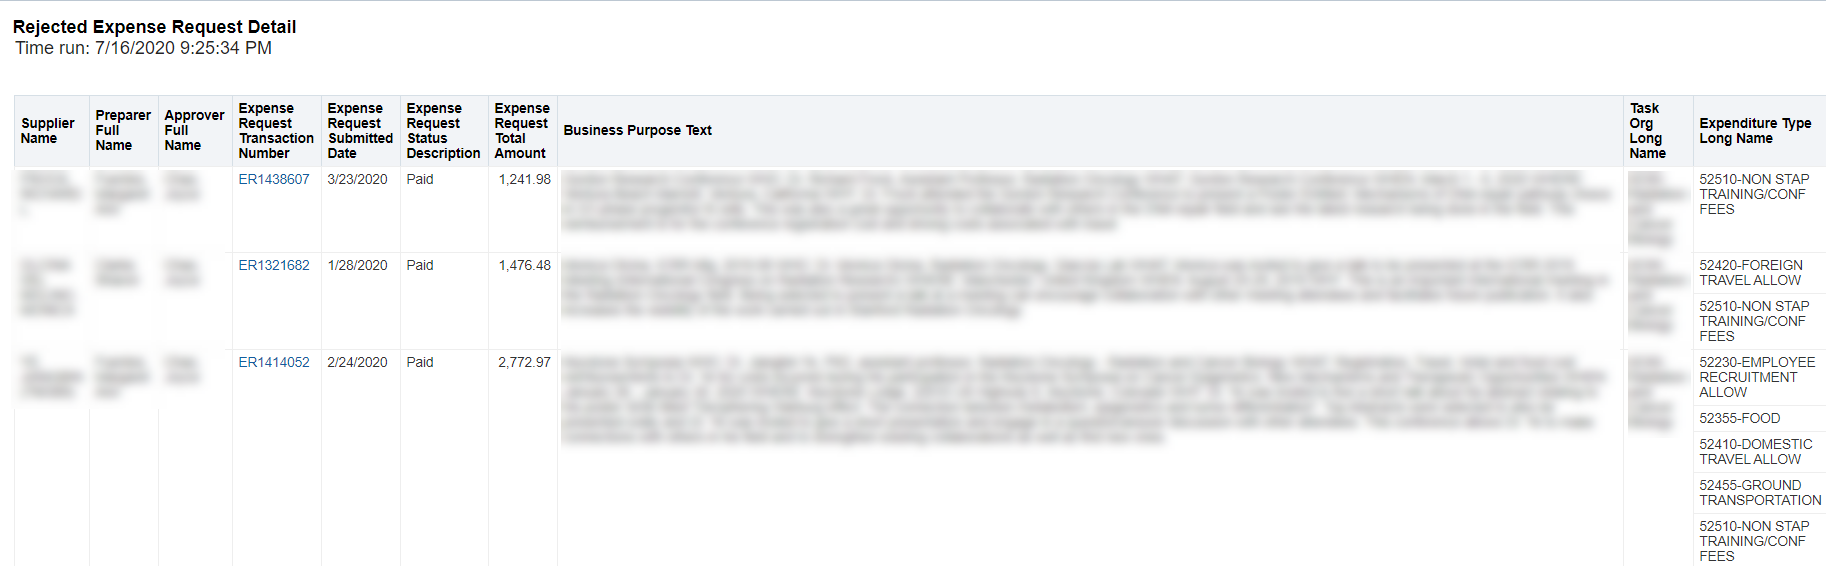
Expense Request Detail Drills
For each of the ER Rejection Statistics sections, you can drill on the expense request transaction counts or the pie chart slices to display Expense Request Detail on the related expense requests. You can further drill on the Expense Request Transaction Number to view the Expense Request Approval Detail or the Expense Request Dashboard. Refer to the following screenshots.
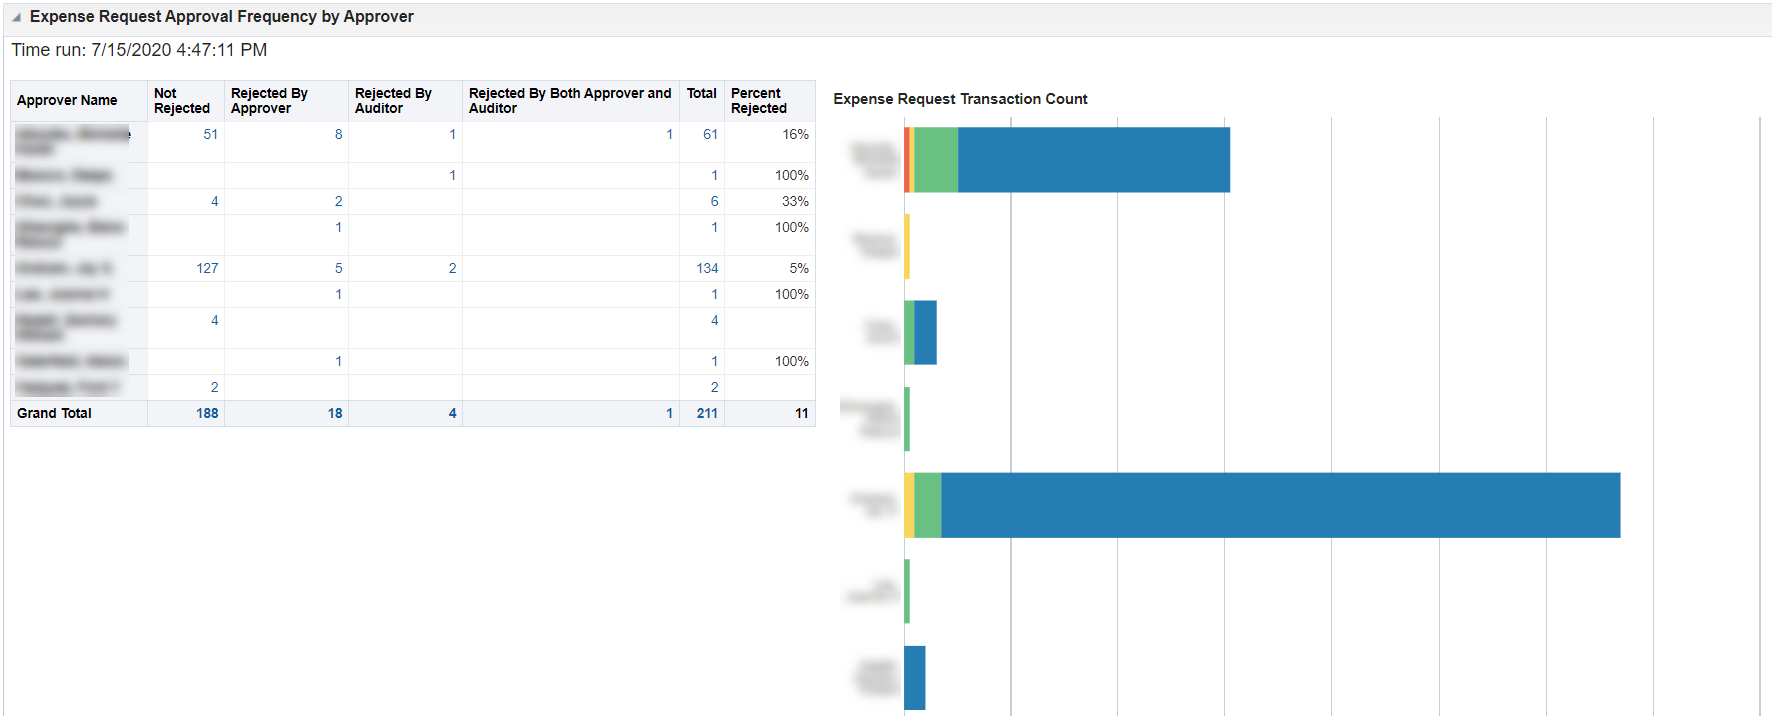
Expense Request (ER) Rejection Detail by Employee
Displays rejection/return rates of expense requests by preparer, approver and supplier/payee.
Sample Business Questions
- By preparer what is the number and rate of expense requests that are rejected/returned? Who needs more guidance and training?
- By approver what is the number and rate of expense requests that are rejected/returned?
- By supplier/payee what is the number and rate of expense requests that are rejected/returned?
Selection Criteria
For best results, be sure to follow the Selection Criteria instructions near the top of the screen. Refer to Using Selection Criteria for OBI Reports for more guidance.
Report Views
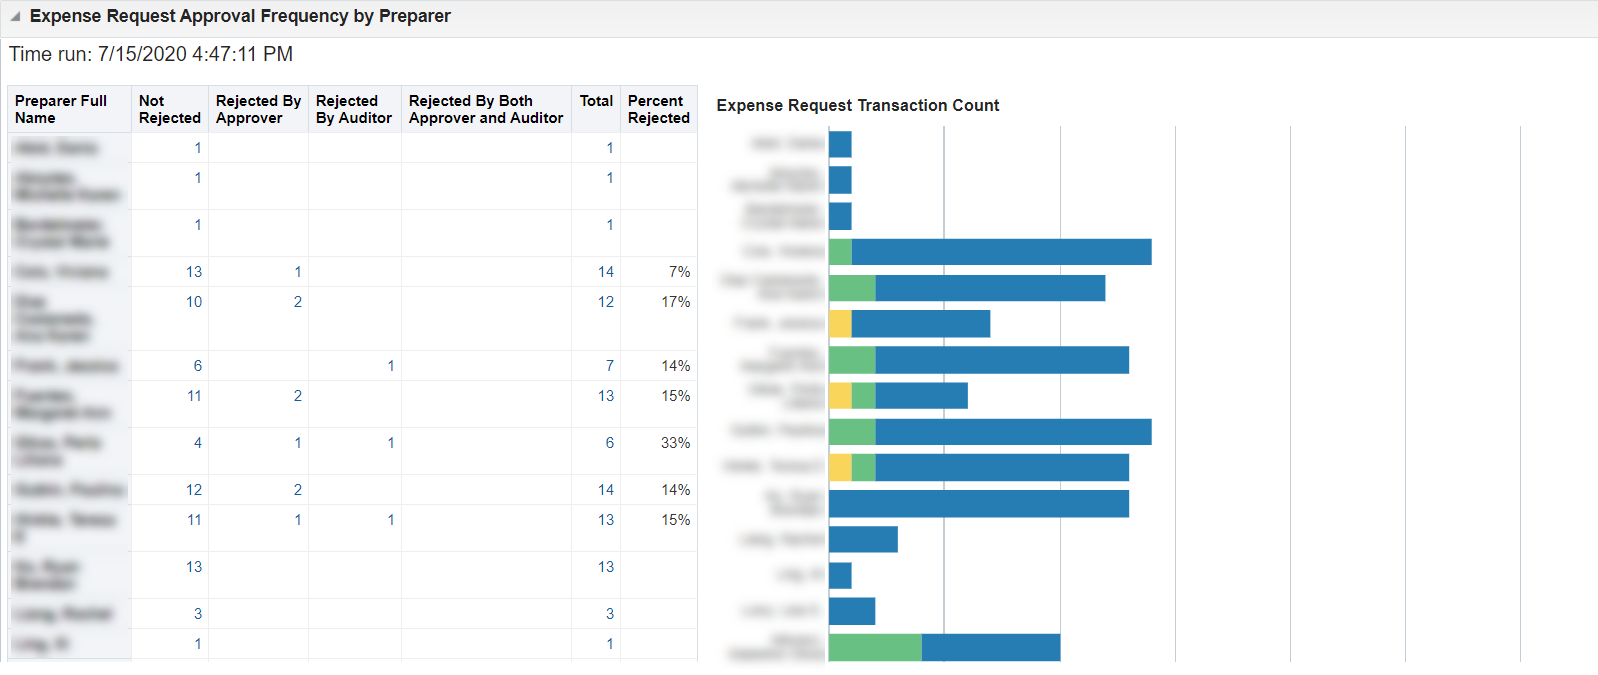
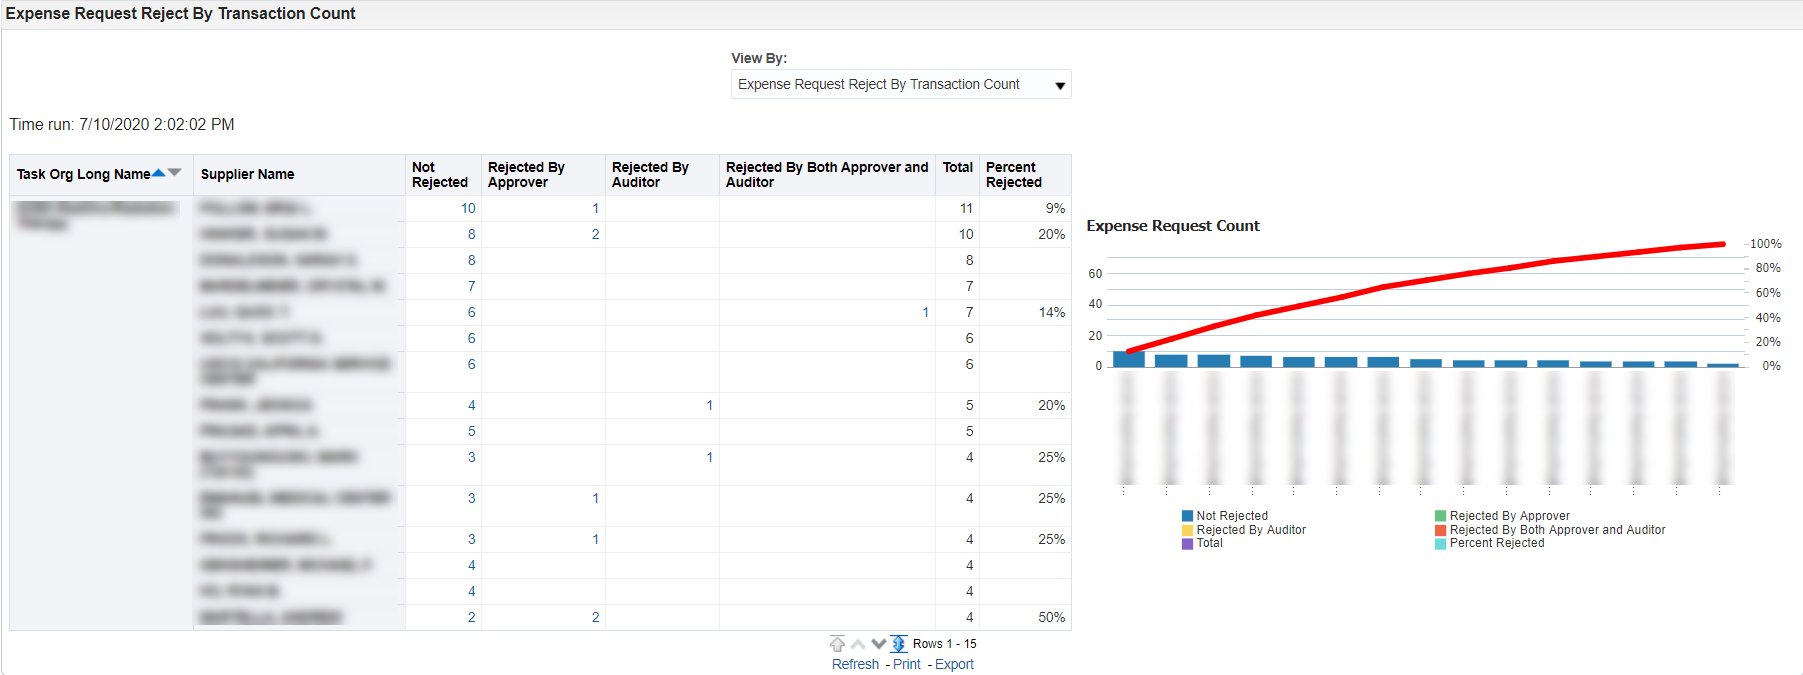
The ER Rejection Detail by Employee displays the counts of expense requests that have and have not been rejected/returned and the percentage of those rejected/returned. This report has three sections that displays different perspectives based on transaction stakeholder (preparer, approver and supplier/payee). If the expense request was rejected/returned by both approver and auditor, it would not be double counted in the other categories. Refer to the following screenshots.
In the reports and graphics, rejection counts include both rejections and expense request returns to the preparer.
Expense Request Detail Drills
For the Expense Request Approval Frequency sections, you can drill on the expense request transaction counts or bar chart segments to display Expense Request Detail on the related expense requests. You can further drill on the Expense Request Transaction Number to view the Expense Request Approval Detail or the Expense Request Dashboard. Refer to the following screenshots.
Expense Request (ER) Processing Statistics
Displays expense request average processing times and trends over time.
Sample Business Questions
- How long is it taking within an organization on average to submit and approve an expense request? What are the trends within my organization?
- How long on average are the preparer’s in my organization taking to submit an expense request? How long is it taking on average for the expense requests for a supplier/payee to be submitted?
- How long is my organization taking to approve expense requests and which ones are taking longer to approve and why?
Selection Criteria
For best results, be sure to follow the Selection Criteria instructions near the top of the screen. Refer to Using Selection Criteria for OBI Reports for more guidance.
Report Views
The Expense Request (ER) Processing Statistics report contains three sections that display statistics about the processing of expense requests that have already been paid.
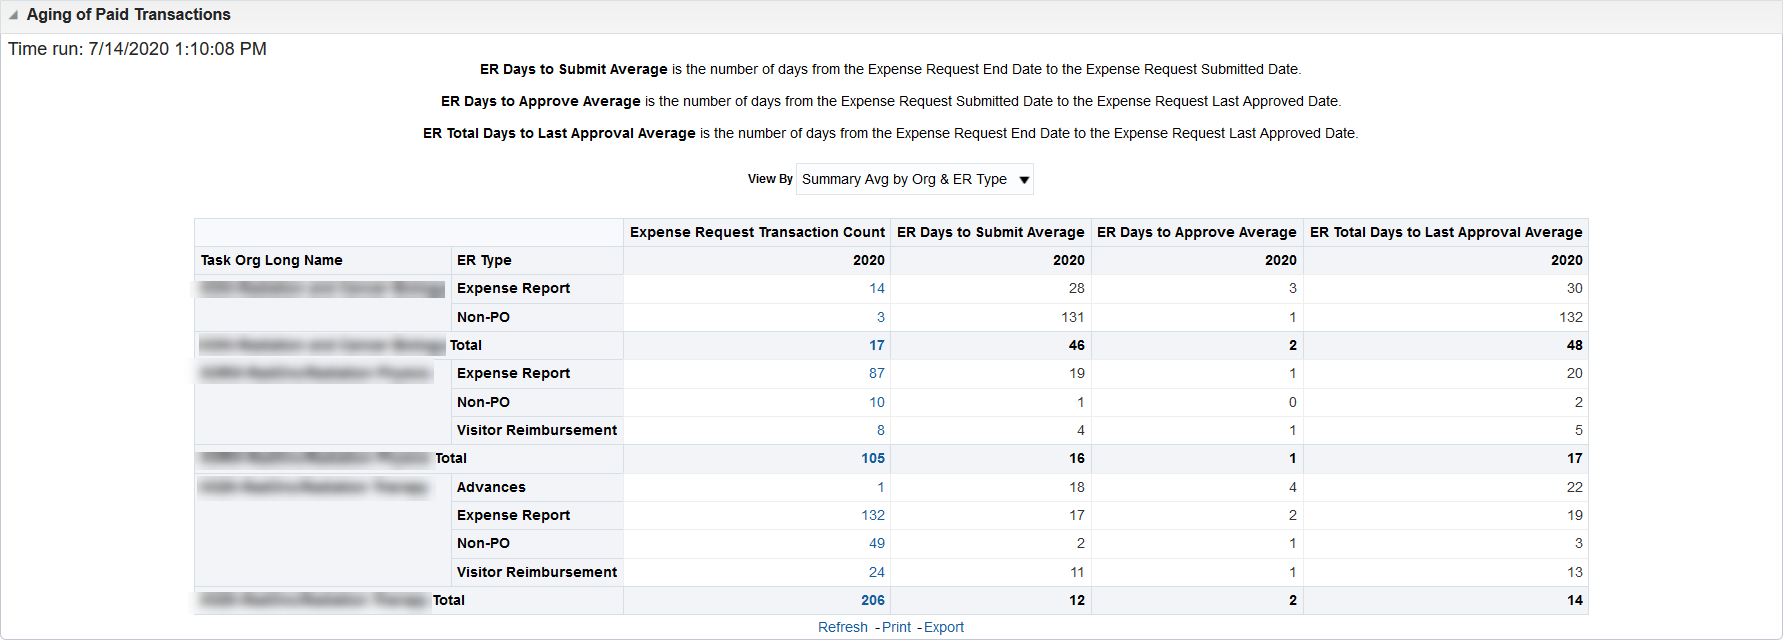
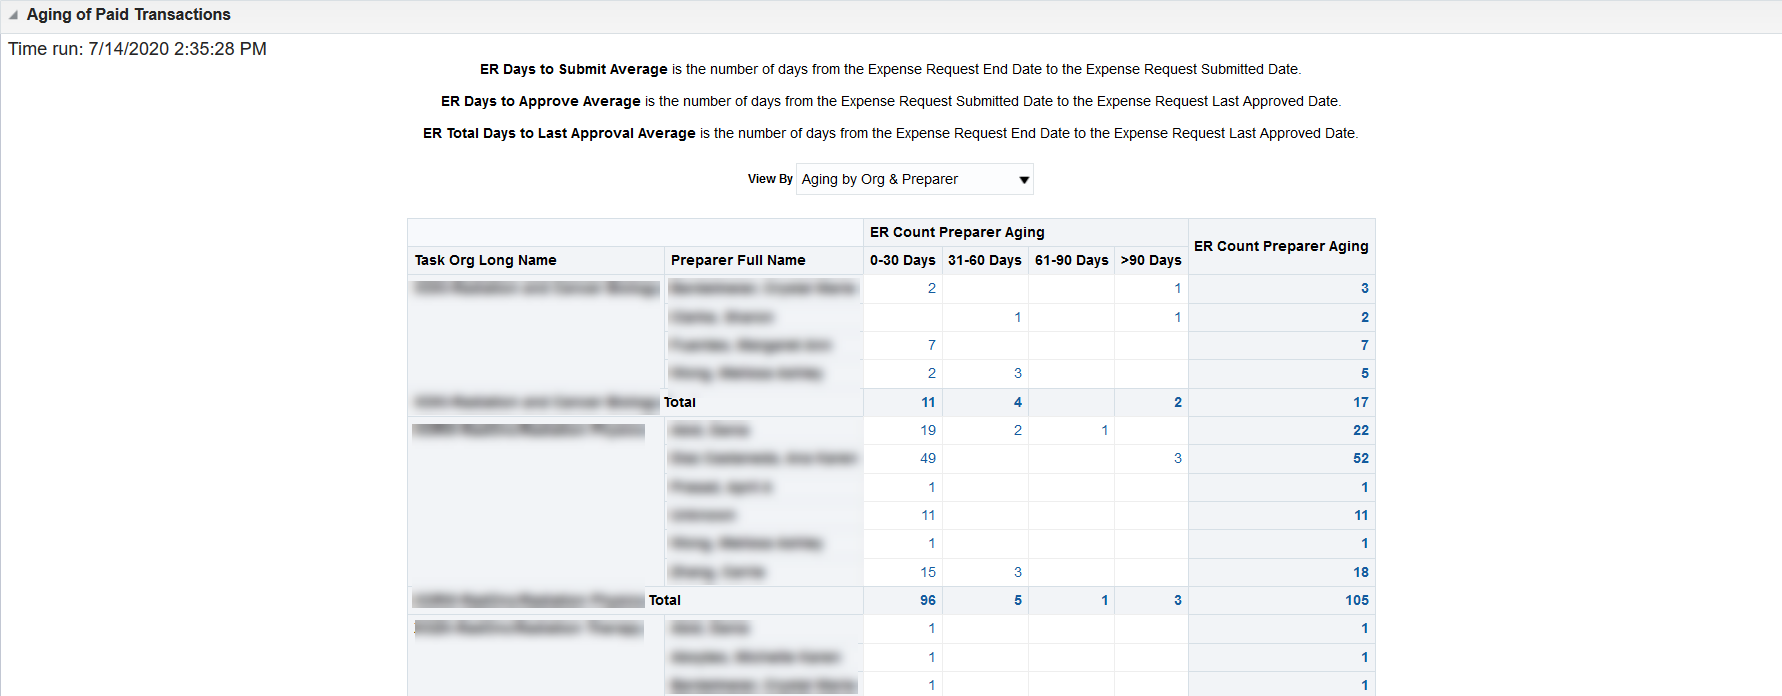
Aging of Paid Transactions
Based on the selected view, displays the count of paid expense requests, the average number of days to submit, the average number of days for local approval and the average total number of processing days.
By organization and expense request type, displays in aging buckets the average number of days for paid expense requests to be submitted, locally approved and processed.
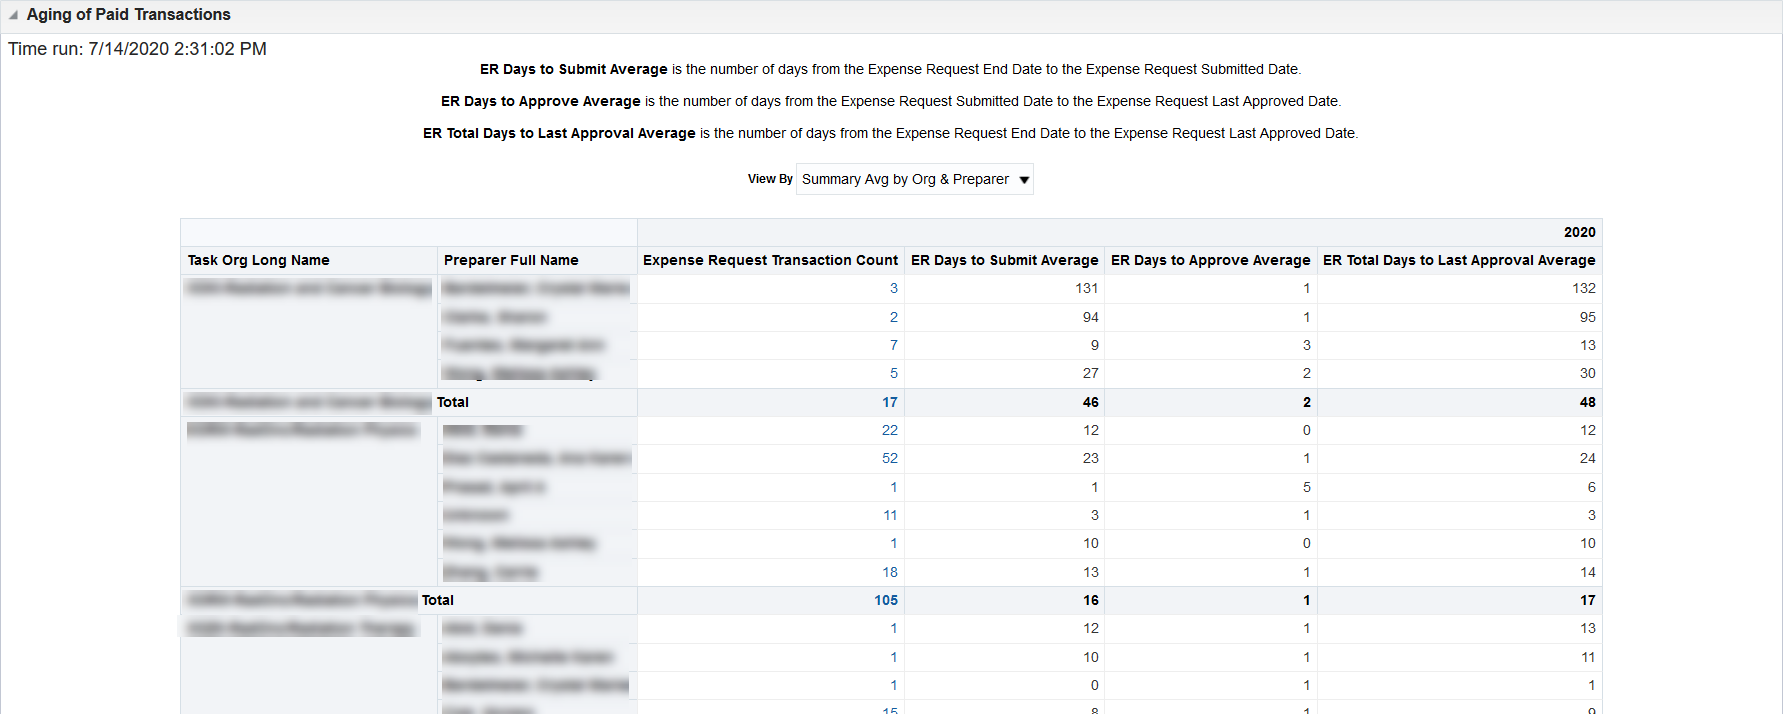
By organization and preparer, displays in aging buckets the average number of days for paid expense requests to be submitted, locally approved and processed.
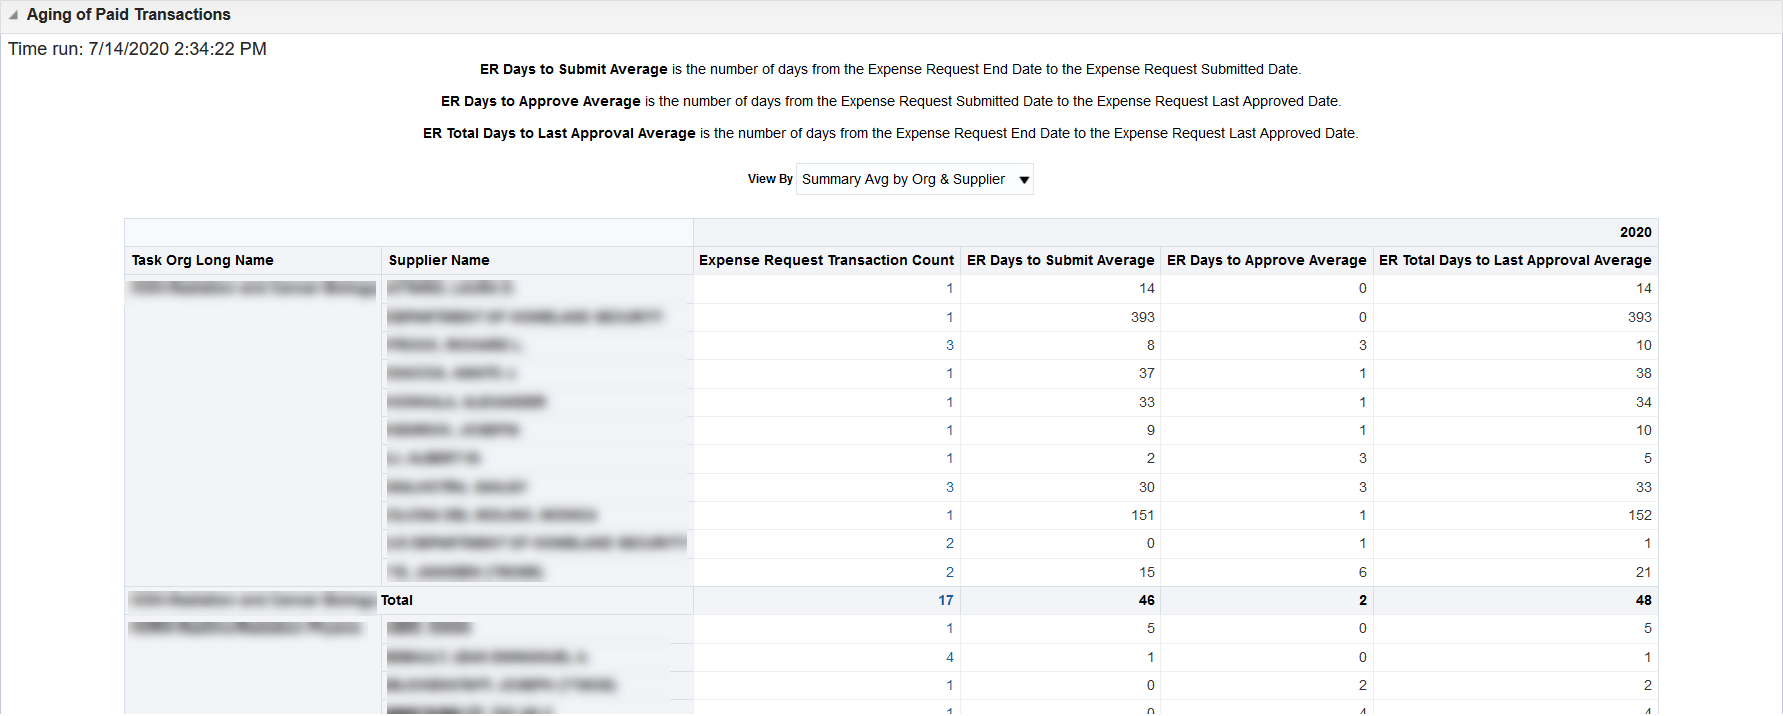
By organization and supplier/payee, displays in aging buckets the average number of days for paid expense requests to be submitted, locally approved and processed.
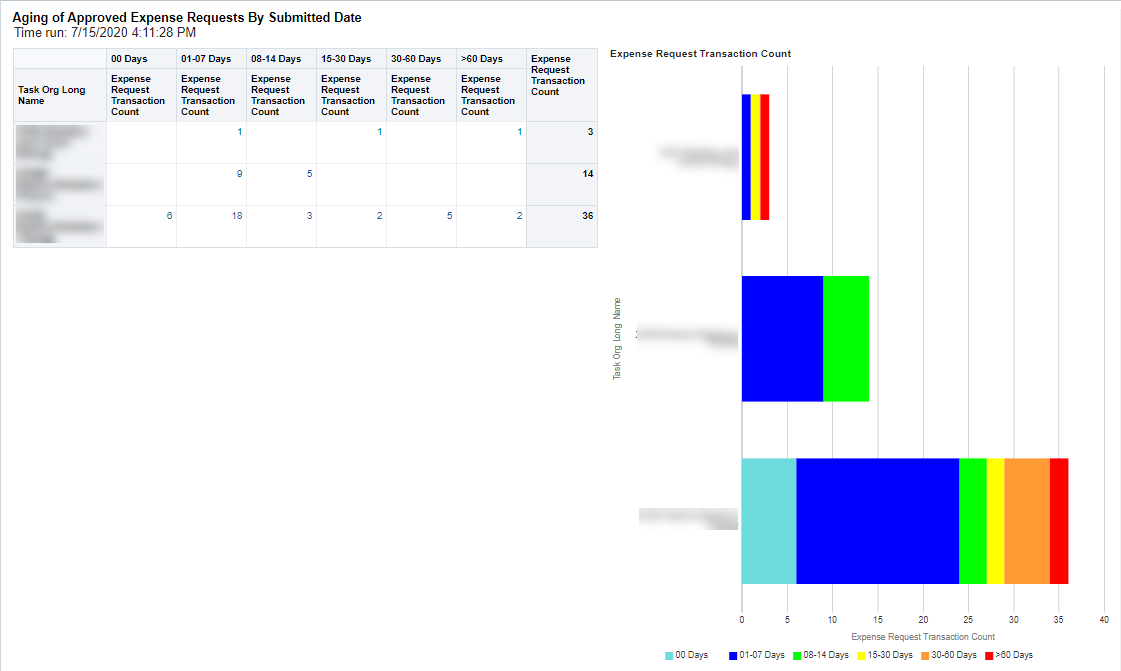
By organization and preparer, displays the count of paid expense in aging buckets.
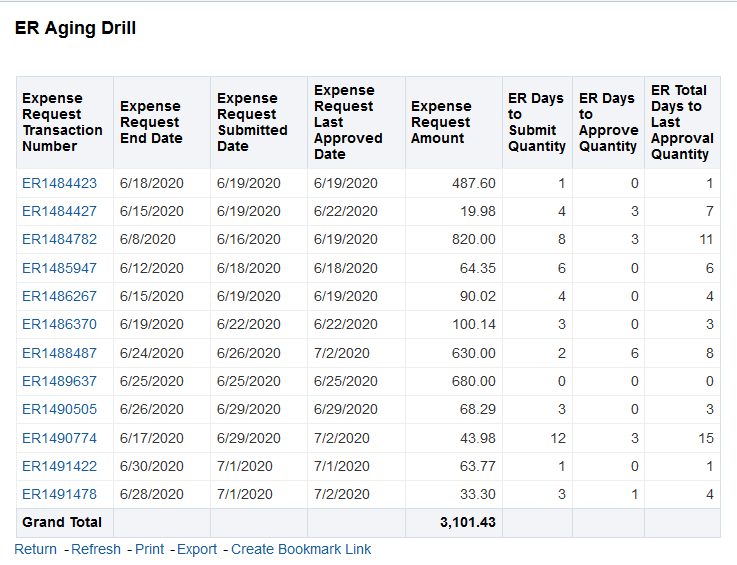
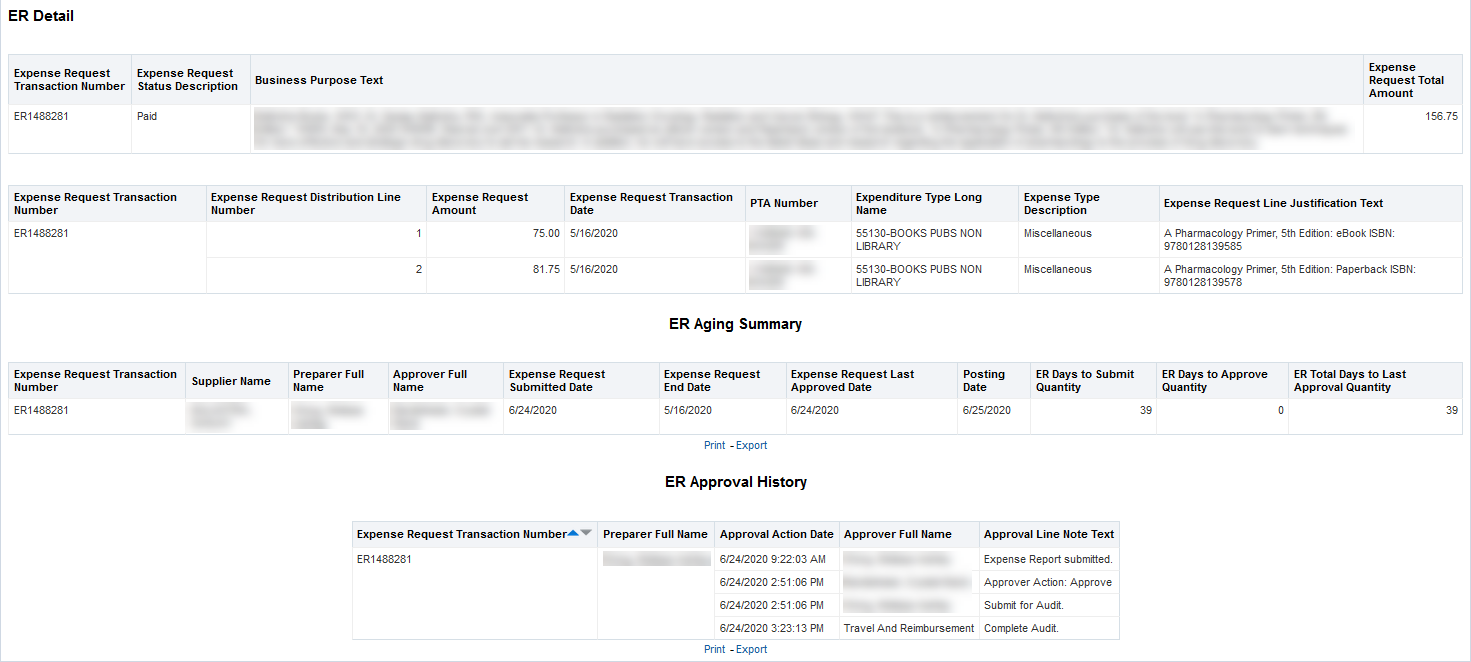
Aging of Paid Transaction Detail Drills
Within the Aging of Paid Transaction reports, you can drill into the Expense Request Transaction Count to get a list of the related expense requests in the Expense Request Aging Drill screen. Within that screen, you can further drill into the Expense Request Transaction Number to view the Expense Request Detail screen which displays details about the expense request, including business purpose, line item details and approval history. Refer to the following screenshots.
Average Submission Time
These reports show submission and approval time trends over the selected time range.
Displays trend line of average time to submit expense requests for approval.
Average Approval Time
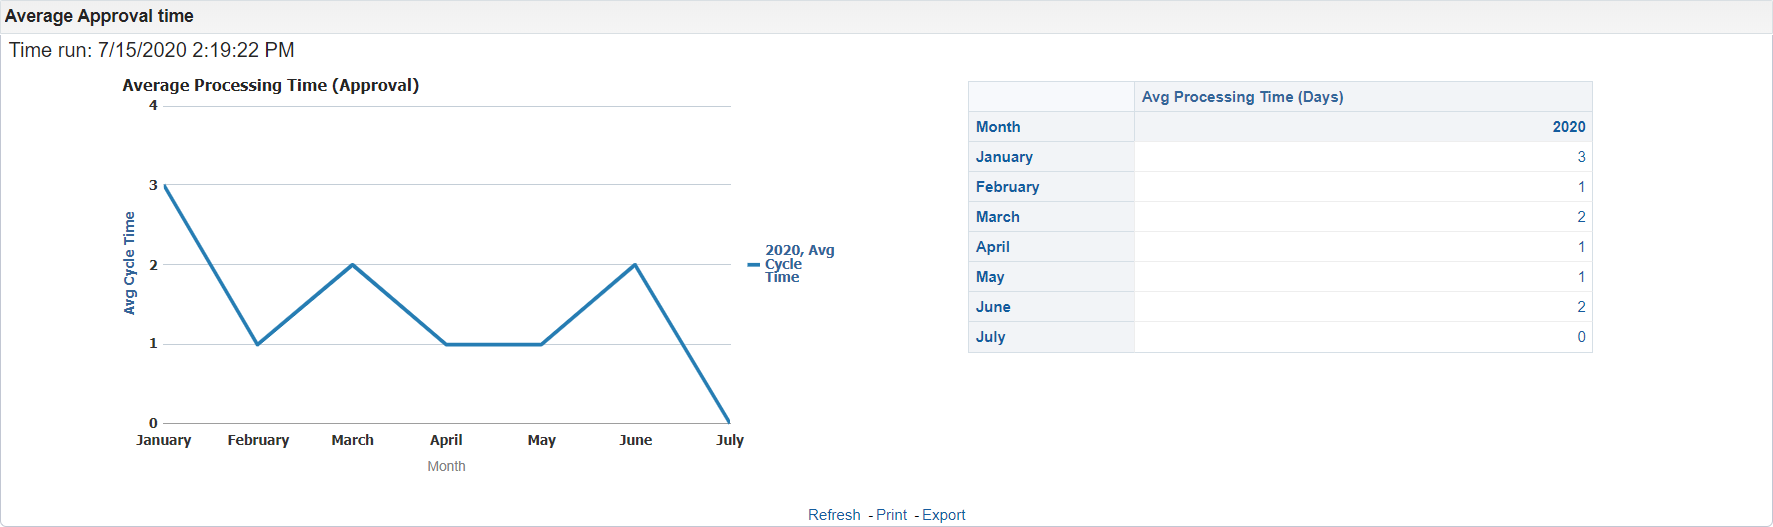
Displays trend line of average time between submission and local final approval of expense requests.
Average Submission and Approval Detail Drills
For both the Average Submission Time and Average Approve Time sections, selecting the Average Processing Time (Days) numbers in the table displays ER counts by aging buckets. You can then drill on the bucket transaction count to get details on the individual ERs.
Understanding the Data
To understand the dates used to determine the processing metrics, refer to the following table.
| Field | Description |
|---|---|
| Expense Incurred Date | The date the actual activity occurred that is entered in the line item detail of the expense request. |
| Expense Request End Date | The latest expenditure item date of all the transactions included in the expense request. |
| Expense Request Submitted Date | The date the expense request was most recently submitted for approval. |
| Expense Request Last Approved Date | The date of the most recent local approval. Does not include time used for central approval. |
Expense Request Processing and Aging Flowchart

Expense Requests in Range
Within a min and max dollar range, displays expense requests by preparer.
Sample Business Questions
- How can I focus on and analyze those transactions within a higher expense range?
Selection Criteria
For best results, be sure to follow the Selection Criteria instructions near the top of the screen. Refer to Using Selection Criteria for OBI Reports for more guidance.
Report Views
The Expense Requests in Range report displays expense request transactions that fall within the range of the selected amounts This report allows you to narrow your search on transactions and perform more efficient analysis of certain transaction categories.
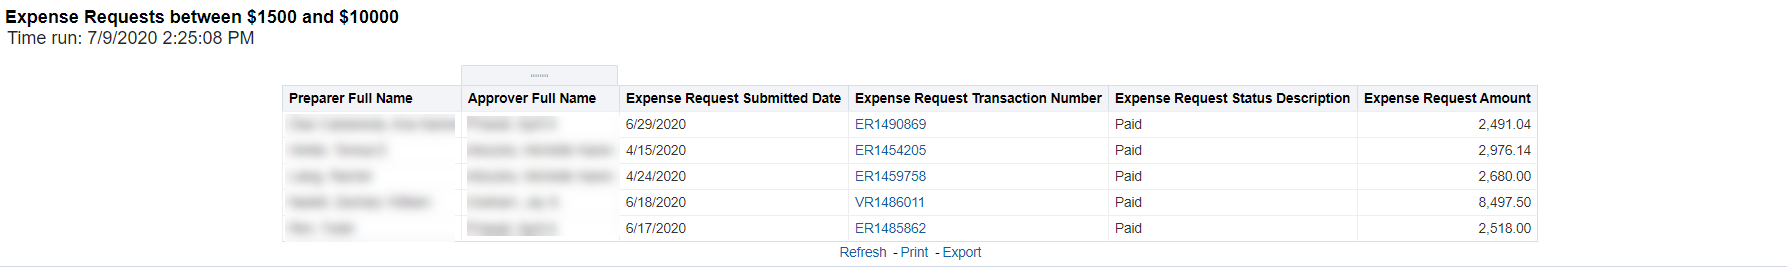
Expense Request Detail Drills
You can drill on the Expense Request Transaction Number to display Expense Request Approval Detail or the Expense Request Dashboard for that particular ER.
Expense Request (ER) Detail by Employee
Displays top payees, preparers and approvers for each organization by both count and dollar amount. Displays rejection/return rates for payees, preparers and approvers for each organization.
Sample Business Questions
- How is the workload of expense request processing distributed throughout my organization?
- Which supplier/payee has the highest dollar amount of expense request submissions over a period of time?
- Where should I focus my training on when it comes to minimizing expense request rejections and reducing resubmissions?
Selection Criteria
For best results, be sure to follow the Selection Criteria instructions near the top of the screen. Refer to Using Selection Criteria for OBI Reports for more guidance.
Report Views
The Expense Request (ER) Detail by Employee displays in both tabular and graphical form the volume of expense requests for each stakeholder: supplier/payee, preparer and approver. The reports display the data from four different views. Refer to the following screenshots.
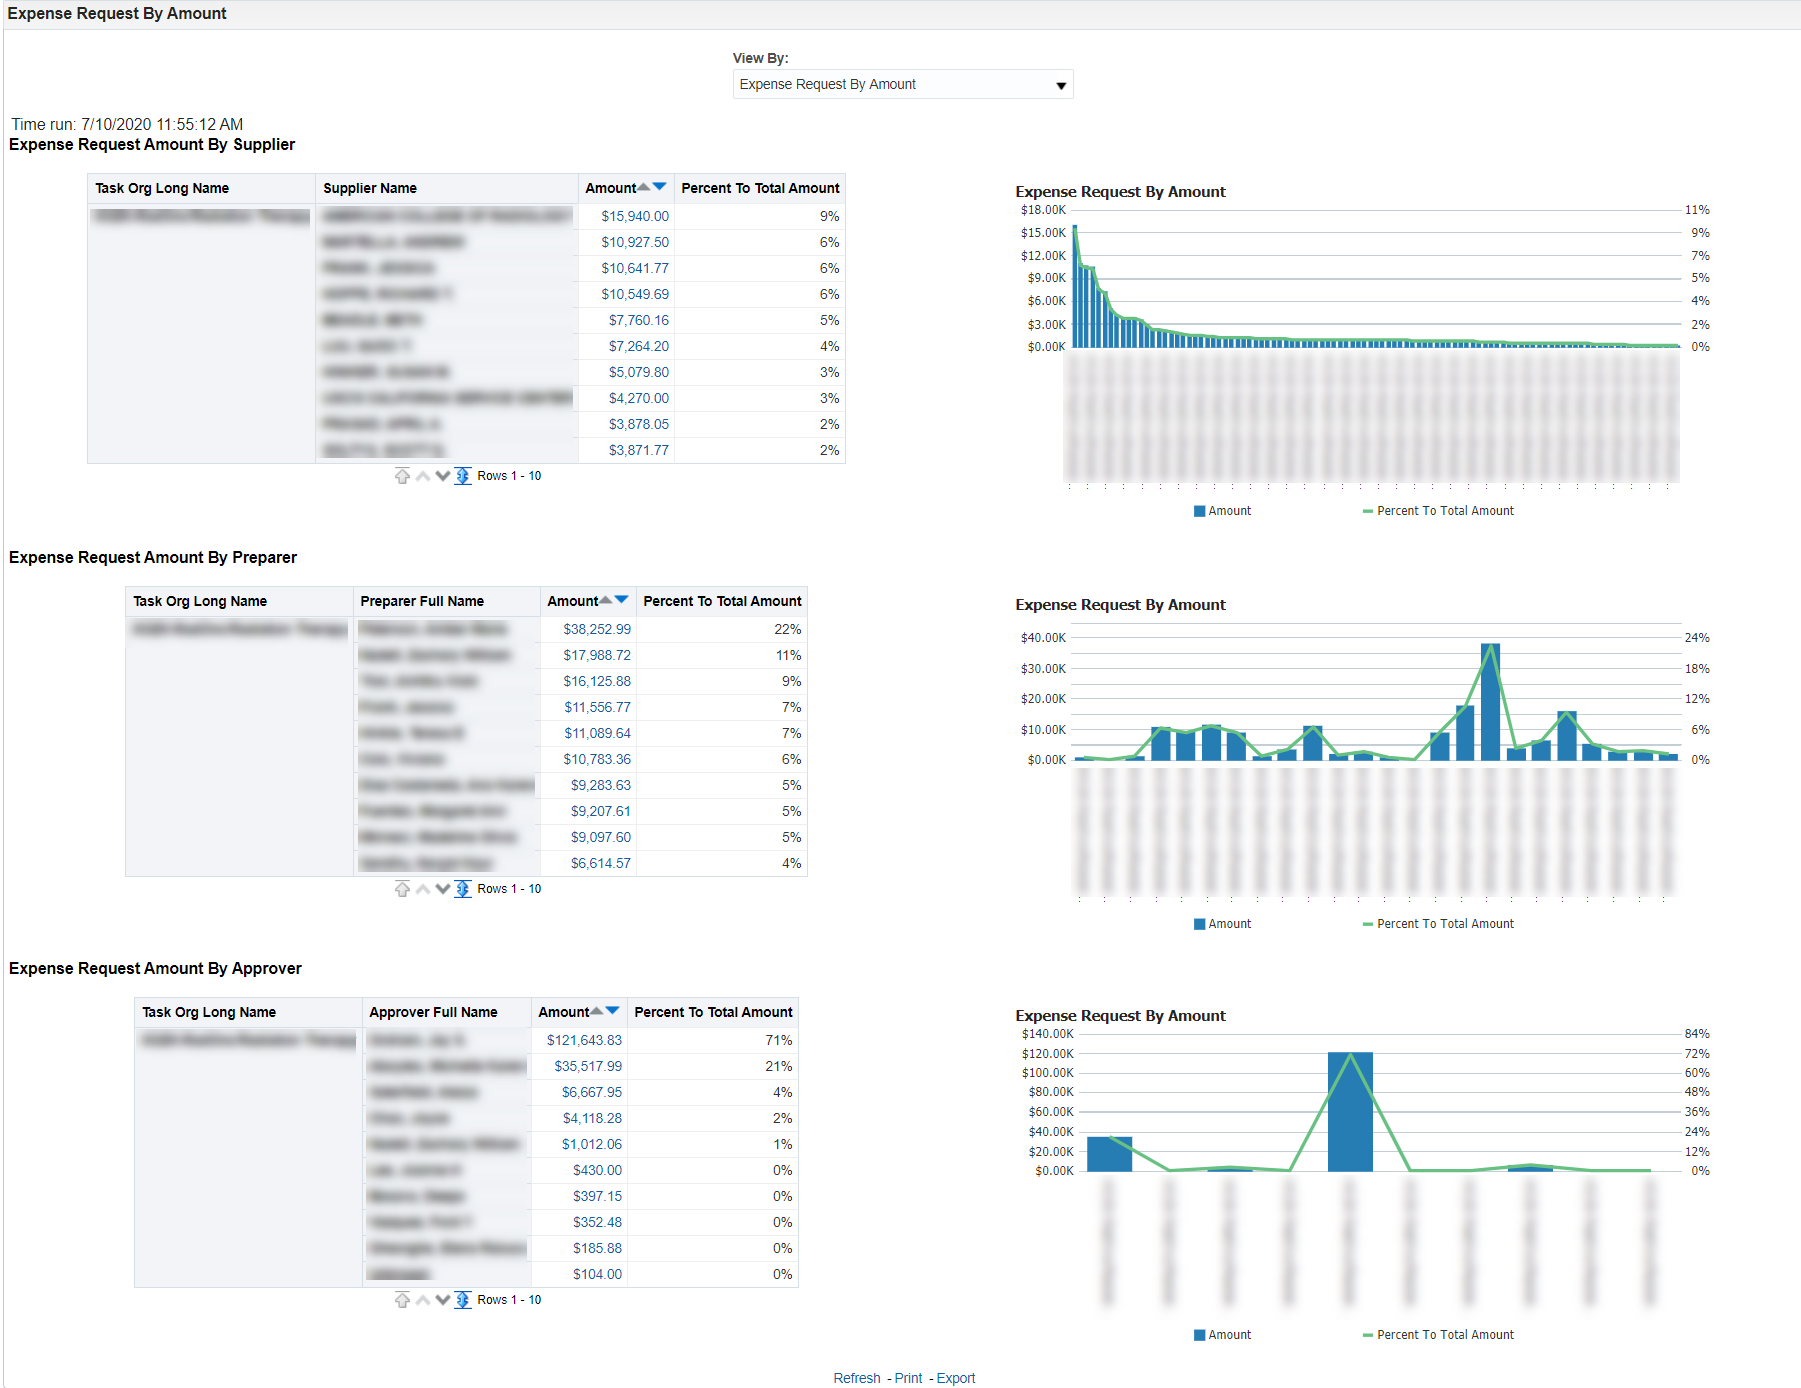
By organization, displays the expense request amounts by supplier/payee, preparer and approver within the selected date range.
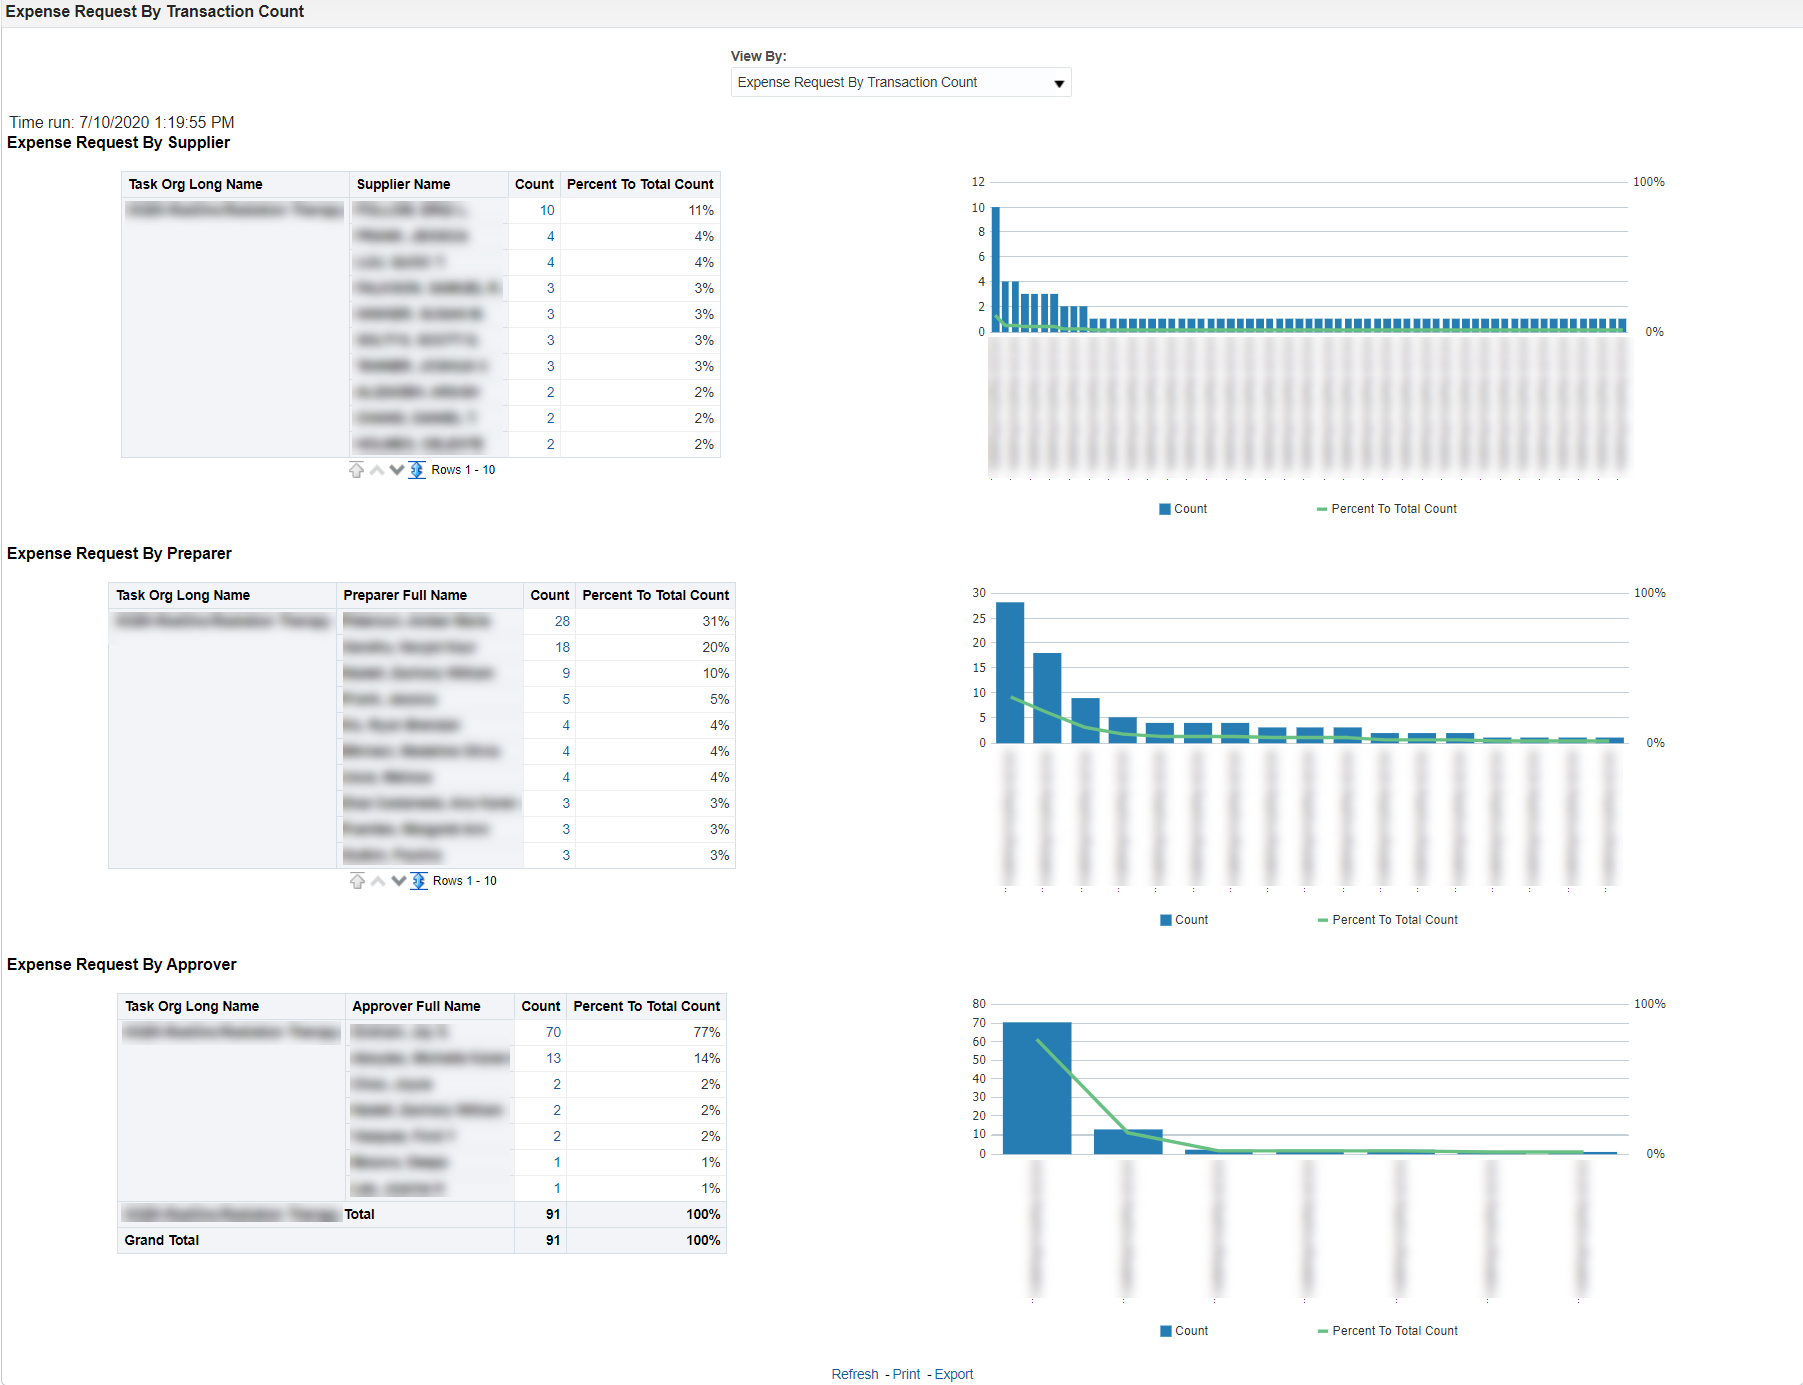
By organization, displays from highest to lowest the expense request transaction counts by supplier/payee, preparer and approver within the selected date range.
Displays the expense request amounts, expense requests that have not been rejected/returned or have been rejected/returned by an approver, auditor or both.
Displays by transaction count, expense requests that have not been rejected/returned or have been rejected/returned by an approver, auditor or both.
Expense Request Detail Drills
You can drill on the expense request total dollar amounts or transaction counts to get Expense Request Details on the related expense requests. Within the Expense Request Detail screen, you can select the Expense Request Transaction Number to drill to Expense Request Approval Detail or the Expense Request Dashboard. Refer to the screenshots below.
Expense Request (ER) Escalation
Displays the count of escalated expense request transactions and whether they have been approved or rejected/returned.
Sample Business Questions
- Which transactions were sent to the escalation designee?
- Where are there needs for more policy discussion and training?
Selection Criteria
For best results, be sure to follow the Selection Criteria instructions near the top of the screen. Refer to Using Selection Criteria for OBI Reports for more guidance.
Report Views
For an organization, displays the number of expense requests that have been escalated.
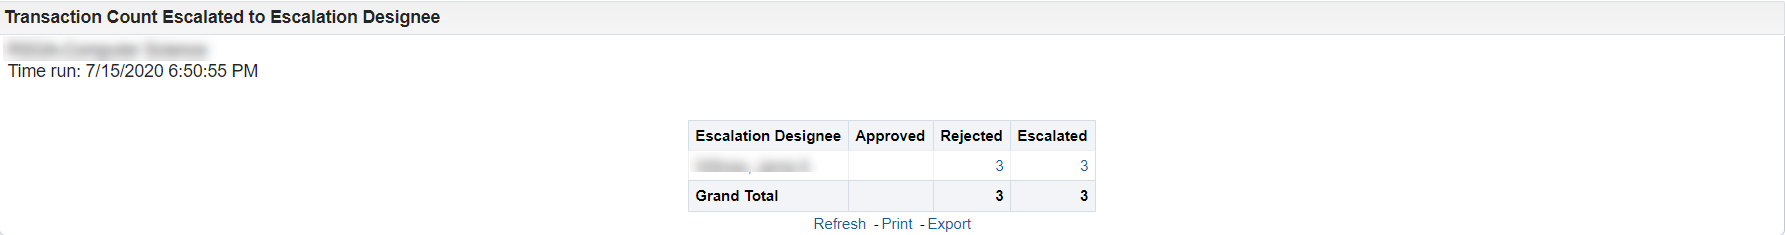
Displays the count of expense request transactions, their approval status that have been escalated within the selected date range.
You can drill into the transaction counts to view the related Expense Requests approval details.